

Hypothalamic hamartomas: Correlation of MR imaging and spectroscopic findings with tumor glial content
- PMID: 16611766
- PMCID: PMC8133985
Hypothalamic hamartomas: Correlation of MR imaging and spectroscopic findings with tumor glial content
Abstract
Background and purpose: There is variability in the literature concerning the appearance and histology of hypothalamic hamartomas. This study correlates the MR imaging and proton MR spectroscopic properties of hypothalamic hamartomas with histopathologic findings.
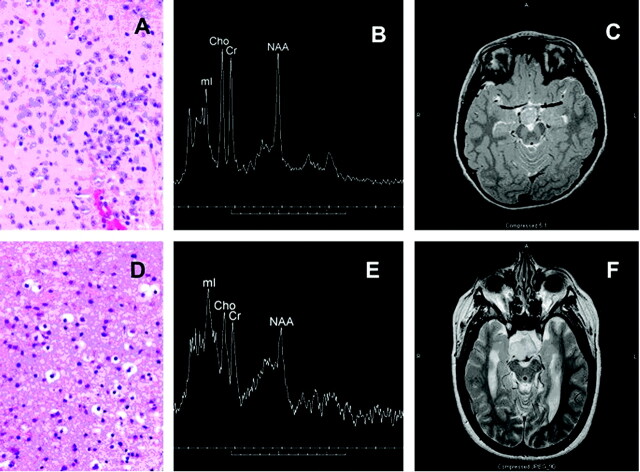
Methods: Studies were performed with 3T and 1.5T scanners. Single voxel hamartoma spectra were acquired by using short-echo-time point-resolved spectroscopy sequences (PRESS). 2D PRESS chemical shift imaging (CSI) spectroscopic sequences were also obtained for comparison of tumor-derived spectra with normal gray matter of the amygdala. Sequences were used to compare choline (Cho), N-acetylaspartate (NAA), and myoinositol (mI) resonances by using a creatine (Cr) reference. Spectral ratios and T2 signal intensity ratios of the hamartomas were then compared with histopathologic findings.
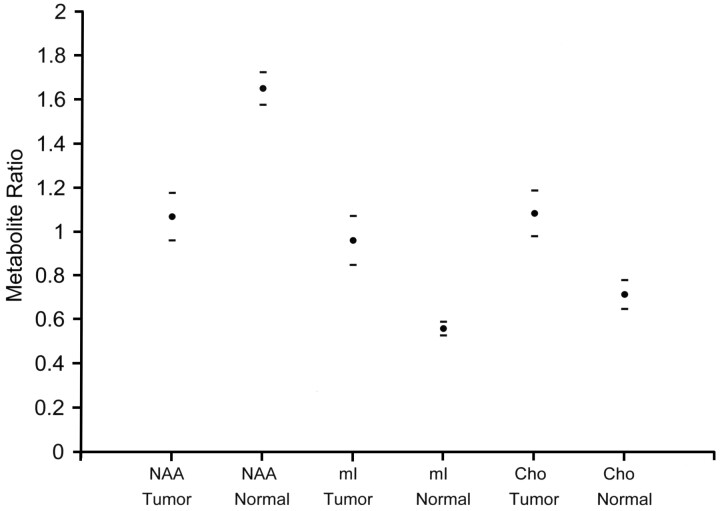
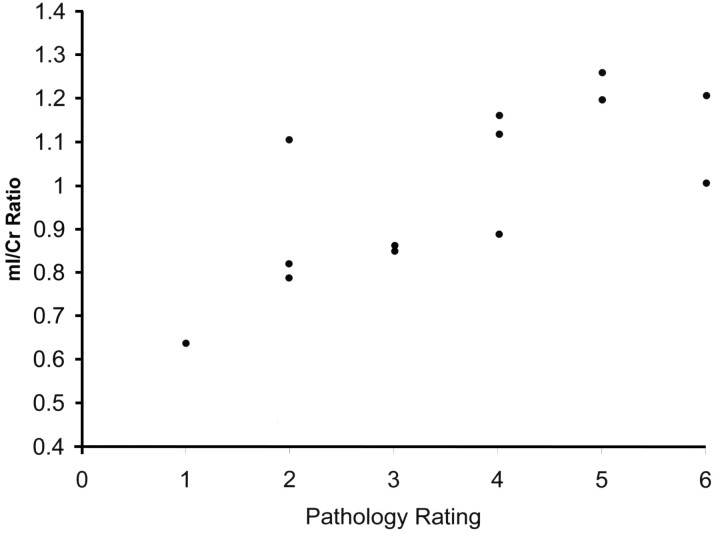
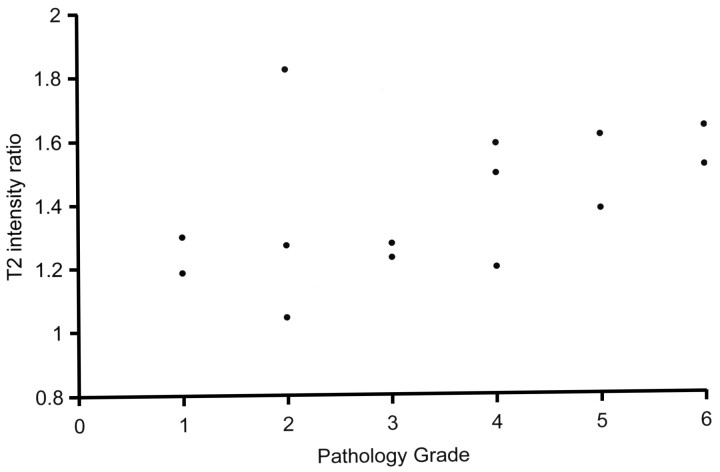
Results: Data from single voxel spectroscopic sequences demonstrated a statistically significant decrease in NAA/Cr and an increase in mI/Cr ratios in tumor tissue when compared with values in normal gray matter of the amygdala. In addition, Cho/Cr ratios were also increased when compared with those in normal gray matter controls. Among the 14 hamartomas sampled, a spectrum of increased mI/Cr ratios was seen. Those tumors with markedly elevated mI/Cr demonstrated an increased glial component when compared with the remaining tumors. Increased glial component was also found to have a positive correlation with hyperintensity of lesions on T2-weighted images.
Conclusion: We have identified a correlation between the glial/neuronal fraction as determined by histopathology and MR spectral and T2 hyperintensity variations among hypothalamic hamartomas.
Figures
References
-
- Judge D, Kulin H, Page R, et al. Hypothalamic hamartoma: a source of luteinizing-hormone-releasing factor in precocious puberty. N Engl J Med 1977;296:7–10 - PubMed
-
- Inoue H, Kanazawa H, Kohga H, et al. Hypothalamic hamartoma: anatomic, immunohistochemical, and ultrastructural features. Brain Tumor Pathol 1995;12:45–51 - PubMed
-
- Diebler C, Ponsot G. Hamartomas of the tuber cinereum. Neuroradiology 1983;25:93–101 - PubMed
-
- Veldueza J, Cristante L, Dammann O, et al. Hypothalamic hamartomas: with special reference to gelastic epilepsy and surgery. Neurosurgery 1994;34:949–58 - PubMed
-
- Grossman R, Yousem D. Neuroradiology: The Requisites. 2nd ed. Philadelphia, Pa: Mosby;2003. :548–50
MeSH terms
LinkOut - more resources
Full Text Sources
Medical