. 2006 Apr 12;26(15):3971-80.
doi: 10.1523/JNEUROSCI.0515-06.2006.

Separate populations of receptor cells and presynaptic cells in mouse taste buds

Affiliations

Separate populations of receptor cells and presynaptic cells in mouse taste buds

Richard A DeFazio et al. J Neurosci. .

Abstract

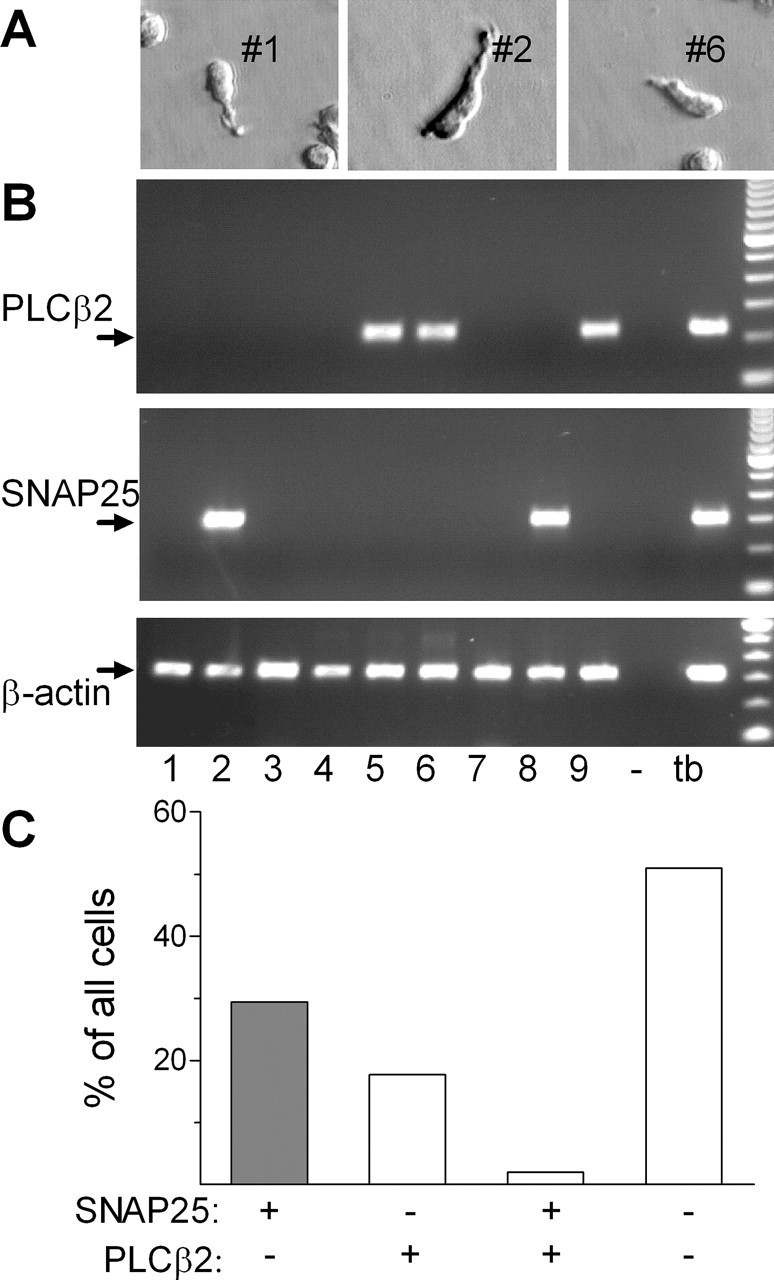
Taste buds are aggregates of 50-100 cells, only a fraction of which express genes for taste receptors and intracellular signaling proteins. We combined functional calcium imaging with single-cell molecular profiling to demonstrate the existence of two distinct cell types in mouse taste buds. Calcium imaging revealed that isolated taste cells responded with a transient elevation of cytoplasmic Ca2+ to either tastants or depolarization with KCl, but never both. Using single-cell reverse transcription (RT)-PCR, we show that individual taste cells express either phospholipase C beta2 (PLCbeta2) (an essential taste transduction effector) or synaptosomal-associated protein 25 (SNAP25) (a key component of calcium-triggered transmitter exocytosis). The two functional classes revealed by calcium imaging mapped onto the two gene expression classes determined by single-cell RT-PCR. Specifically, cells responding to tastants expressed PLCbeta2, whereas cells responding to KCl depolarization expressed SNAP25. We demonstrate this by two methods: first, through sequential calcium imaging and single-cell RT-PCR; second, by performing calcium imaging on taste buds in slices from transgenic mice in which PLCbeta2-expressing taste cells are labeled with green fluorescent protein. To evaluate the significance of the SNAP25-expressing cells, we used RNA amplification from single cells, followed by RT-PCR. We show that SNAP25-positive cells also express typical presynaptic proteins, including a voltage-gated calcium channel (alpha1A), neural cell adhesion molecule, synapsin-II, and the neurotransmitter-synthesizing enzymes glutamic acid decarboxylase and aromatic amino acid decarboxylase. No synaptic markers were detected in PLCbeta2 cells by either amplified RNA profiling or by immunocytochemistry. These data demonstrate the existence of at least two molecularly distinct functional classes of taste cells: receptor cells and synapse-forming cells.


Figures

Figure 1.
Figure 1.
Taste cells respond with a transient elevation of Ca2+ to potassium depolarization or to taste stimulation but not to both. A, An example of an isolated taste cell (arrow) loaded with Calcium Green-1 dextran and viewed in bright-field illumination (left) or epifluorescence (right) to image Ca2+. Scale bars, 20 μm. B, Summary of all data from functional testing. Five percent (53 of 1032) of cells responded to KCl depolarization with a Ca 2+ transient, whereas 3% (34 of 1032) responded to the tastant mix. Of all 1032 cells tested with KCl and the tastant mix, none generated a Ca2+ response to both stimuli. The two populations were distinct and nonoverlapping. Cells responding to KCl depolarization, provisionally identified as presynaptic cells in this report, are shown by a shaded bar. C, Representative trace from a cell in which a Ca2+ response was evoked by potassium depolarization (50 mm KCl) but not by tastant stimulation [2 mm saccharin (sac) plus 100 μm cycloheximide (chx)], shown as bars above the trace. Across the population, the order of stimulus presentation did not alter the result. D, Representative trace from a cell in which taste stimulation but not potassium depolarization evoked calcium responses. Stimuli were presented as in C.
Figure 2.
Figure 2.
Single-cell RT-PCR reveals that individual taste cells express PLCβ2 or SNAP25, with little overlap between the two. A, Images of isolated single cells collected for RT-PCR analysis. Numbers next to cells correspond to those below the gels in B. B, Ethidium-stained agarose gels of RT-PCR for PLCβ2, SNAP25, and β-actin in nine individual cells (1–9). RT-PCR for β-actin served as a control to validate the quality of each sample. The lane marked with “–” was processed for all steps from RNA extraction to PCR but without including a cell. A positive control for RT-PCR was performed with taste bud cDNA (tb), which is expected to include sequences for all expressed genes. C, Summary of RT-PCR data from 51 taste cells, analyzed as above. Cells expressing SNAP25 and not PLCβ2, identified as presynaptic cells in this report, are shown by a shaded bar. Only a single cell showed RT-PCR product for both PLCβ2 and SNAP25. Approximately one-half of analyzed cells showed neither of these two taste-selective markers.
Figure 3.
Figure 3.
Taste cells expressing PLCβ2 (i.e., receptor cells) do not respond to KCl depolarization. A, Cryosections of fixed circumvallate papilla from a PLCβ2-GFP mouse demonstrate accurate expression of GFP. Sections were immunostained with anti-PLCβ2 (red). Confocal micrographs show the following: Aa, PLCβ2 immunofluorescence; Ab, GFP fluorescence; Ac, merged image, with near-perfect overlap (yellow–orange). B, Living tissue showing a lingual slice preparation from a PLCβ2-GFP mouse in which vallate taste cells were loaded with the Ca2+ indicator CaO. Superimposed fluorescence from CaO (red) and GFP (green) reveals one cell that expresses GFP and is also loaded with CaO dye (yellow, arrow). Other cells are either dye loaded but do not express GFP (red) or express GFP but are not dye-loaded (green). C, Taste cell responses (ΔCa2+) were recorded in lingual slice preparations of the circumvallate papilla from PLCβ2-GFP mice. Preparations were sequentially stimulated with the bitter tastant cycloheximide (chx) and depolarized with 50 mm KCl. The traces show superimposed responses from two cells lacking GFP (black) and two GFP-labeled taste cells (green). Bars below traces indicate the stimulation. Responses to depolarization were only observed in cells lacking GFP. We recorded from 131 CaO-loaded taste cells in 13 slices from four PLCβ2-GFP transgenic mice. None of the 31 dye-loaded cells that were GFP positive responded to K+ depolarization. In contrast, K+ depolarization evoked responses in 31 of 100 cells lacking GFP. The difference in the frequency of KCl responsivity between the GFP-expressing and nonexpressing cells is highly significant (p < 0.001; two-tailed Fisher’s exact test). pos, Positive; neg, negative.
Figure 4.
Figure 4.
RT-PCR for additional presynaptic genes expressed in taste buds. A, RT-PCR for three voltage-gated calcium channel α1 subunits. The templates used were cDNA from taste bud (tb), nontaste lingual epithelium (nt), water as a negative control (−), and brain (br) as a positive control. Bands of the expected sizes for each gene (430 bp for α1A; 688 bp for α1B; 596 bp for α1C) are indicated on the left. The last lane on the right is a 100 bp ladder. B, RT-PCR for NCAM, GAD1, and synapsin II using cDNA templates as in A. Bands of the expected sizes for each gene (228 bp for NCAM; 240 bp for GAD1; 268 bp for synapsin II) are indicated on the left. C, RT-PCR for the neuronal (490 bp) and non-neuronal (493 bp) isoforms of AADC, using cDNA templates as in A. In addition, we used kidney cDNA (K) as a positive control template for the non-neuronal (non-neuro) form. The neuronal form is not expressed in kidney (Jahng et al., 1996).
Figure 5.
Figure 5.
Gene expression profiling of aRNA from individual taste cells supports their classification as receptor cells and presynaptic cells. A, An example of RT-PCR data based on aRNA from a typical profiled cell. Each gene was tested using 4% of the single-cell cDNA. This cell, which is 12 in B, clearly expresses the presynaptic genes but none of the chemosensory transduction genes. B, Compilation of data from 21 cells: each row represents a single cell, and each column after the first represents a different gene. The table shows 10 cells that expressed PLCβ2 (1–10), 10 cells that expressed SNAP25 (12–21), and one cell that expressed both (11). · denotes that RT-PCR product was detected, and − denotes the apparent lack of expression in parallel reactions. C, Histogram of the incidence of expression of each profiled gene from single cells expressing PLCβ2 (white bars) and cells expressing SNAP25 (gray bars). The incidence of expression of genes across the two populations was nonrandom when evaluated in the two-tailed Fisher’s exact test. Statistical significances were ∗p ≤ 0.05, ∗∗p ≤ 0.01, or ∗∗∗p ≤ 0.001. (Expression patterns of SNAP25 and PLCβ2 are not included in the statistics because they define the two populations.) The single double-expressing cell (11 from table) is shown as a separate set of bars (hatched) and was not included in the statistics because of the low incidence of this type (≤2%).
Figure 6.
Figure 6.
PLCβ2 protein is found in distinct cells from those expressing presynaptic proteins, SNAP25, NCAM, or AADC. A, B, PLCβ2 expression does not overlap significantly with SNAP25. In A, cryosections (25 μm) from circumvallate papillae from wild-type mice were double immunostained for SNAP25 (red, center) and PLCβ2 (green, left). The merged images (right) demonstrate lack of coexpression. In B, cryosections from a PLCβ2-GFP transgenic mouse were immunostained for SNAP25 (red). A similar lack of coexpression is evident (see merge, right). The apparent slight overlap at the apex of the taste bud in the merged image may be attributable to the convergence of the apical tips of several taste cells in the taste pore, combined with the ∼3 μm optical thickness of the confocal images. C, Nonoverlap of PLCβ2 and NCAM expression, revealed by immunostaining for NCAM on tissue from PLCβ2-GFP transgenic mice. Note that NCAM immunostaining of taste cells is punctate, as observed previously (Nolte and Martini, 1992). D, Nonoverlap of PLCβ2 and AADC expression, as in B and C. E, Negative control sections immunostained and photographed in parallel with B–D above but omitting the primary antibody. In B–E, the left column shows GFP fluorescence (from PLCβ2-GFP transgenic mice), superimposed on a Nomarski differential interference contrast micrograph of a taste bud. The middle column shows immunostaining for SNAP25, NCAM, or AADC. The right column shows GFP fluorescence and immunofluorescence merged. ab, Antibody. Scale bar, 10 μm.

References

    1. Adler E, Hoon MA, Mueller KL, Chandrashekar J, Ryba NJ, Zuker CS (2000). A novel family of mammalian taste receptors. Cell 100:693–702. - PubMed
    1. Akabas MH, Dodd J, Al Awqati Q (1988). A bitter substance induces a rise in intracellular calcium in a subpopulation of rat taste cells. Science 242:1047–1050. - PubMed
    1. Bachmanov AA, Tordoff MG, Beauchamp GK (2001). Sweetener preference of C57BL/6ByJ and 129P3/J mice. Chem Senses 26:905–913. - PMC - PubMed
    1. Bernhardt SJ, Naim M, Zehavi U, Lindemann B (1996). Changes in IP3 and cytosolic Ca2+ in response to sugars and non-sugar sweeteners in transduction of sweet taste in the rat. J Physiol (Lond) 490:325–336. - PMC - PubMed
    1. Boughter JD Jr, Raghow S, Nelson TM, Munger SD (2005). Inbred mouse strains C57BL/6J and DBA/2J vary in sensitivity to a subset of bitter stimuli. BMC Genet 6:36. - PMC - PubMed

Publication types

LinkOut - more resources