. 2006 May;80(9):4557-69.
doi: 10.1128/JVI.80.9.4557-4569.2006.

Retrovirus-induced oxidative stress with neuroimmunodegeneration is suppressed by antioxidant treatment with a refined monosodium alpha-luminol (Galavit)

Affiliations

Retrovirus-induced oxidative stress with neuroimmunodegeneration is suppressed by antioxidant treatment with a refined monosodium alpha-luminol (Galavit)

Yuhong Jiang et al. J Virol. 2006 May.

Abstract

Oxidative stress is involved in many human neuroimmunodegenerative diseases, including human immunodeficiency virus disease/AIDS. The retrovirus ts1, a mutant of Moloney murine leukemia virus, causes oxidative stress and progressive neuro- and immunopathology in mice infected soon after birth. These pathological changes include spongiform neurodegeneration, astrogliosis, thymic atrophy, and T-cell depletion. Astrocytes and thymocytes are directly infected and killed by ts1. Neurons are not infected, but they also die, most likely as an indirect result of local glial infection. Cytopathic effects of ts1 infection in cultured astrocytes are associated with accumulation of the viral envelope precursor protein gPr80env in the endoplasmic reticulum (ER), which triggers ER stress and oxidative stress. We have reported (i) that activation of the Nrf2 transcription factor and upregulation of antioxidative defenses occurs in astrocytes infected with ts1 in vitro and (ii) that some ts1-infected astrocytes survive infection by mobilization of these pathways. Here, we show that treatment with a refined monosodium alpha-luminol (Galavit; GVT) suppresses oxidative stress and Nrf2 activation in cultured ts1-infected astrocytes. GVT treatment also inhibits the development of spongiform encephalopathy and gliosis in the central nervous system (CNS) in ts1-infected mice, preserves normal cytoarchitecture in the thymus, and delays paralysis, thymic atrophy, wasting, and death. GVT treatment of infected mice reduces ts1-induced oxidative stress, cell death, and pathogenesis in both the CNS and thymus of treated animals. These studies suggest that oxidative stress mediates ts1-induced neurodegeneration and T-cell loss.


Figures
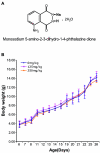
FIG. 1.
FIG. 1.
Chemical structure of GVT and lack of GVT toxicity in mice at therapeutic doses. (A) GVT structure. (B) For studies of the effect of GVT on the growth of FVB/N mice, 6-day-old FVB/N mouse pups were divided into three groups, and the different groups were given intaperitoneal injections of normal saline, GVT in normal saline (250 mg/kg of body weight/day), or GVT in normal saline (125 mg/kg of body weight/day), with injections given 5 days per week. At each time point, six mice from each group were weighed. The graph shows the mean body weight ± standard deviation for each group at each time point. All animals were also observed daily for behavioral and clinical manifestations of drug toxicity.
FIG. 2.
FIG. 2.
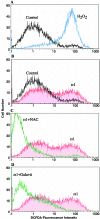
Intracellular H2O2 levels in ts1-infected untreated and ts1-infected GVT-treated primary astrocyte cultures. Uninfected or infected PACs were untreated, treated with 10 μM GVT, or treated with 5 mM NAC. After being cultured for 48 h, one group of uninfected PACs was pulsed with culture medium containing 88 μM H2O2 to serve as a positive control for cells containing elevated H2O2. Cells from all of the cultures were then loaded with 10 μM CM-H2DCFDA for 30 min, followed by flow cytometric measurement of their H2O2 contents. (A) FACS histogram of ROS levels in untreated uninfected PACs (black line) versus H2O2-treated PACs (blue line). (B) FACS histogram of uninfected PACs (black line) versus ts1-infected PACs (red line and red fill). (C) FACS histogram of ts1-infected PACs treated with NAC (green line) versus ts1-infected PACs left untreated (red line and red fill). (D) FACS histogram of ts1-infected PACs treated with GVT (green line) versus ts1-infected PACs left untreated (red line and red fill).
FIG. 3.
FIG. 3.
GVT treatment suppresses Nrf2 nuclear translocation in ts1-infected PACs. Uninfected or infected PACs were either left untreated or treated with 100 μM GVT for 48 h, at which time their nuclear proteins were extracted and immunoblotted with antibody to Nrf2. The results are representative of three independent experiments. Band intensities were then normalized to β-actin intensities and compared for differences between experimental and control conditions.
FIG. 4.
FIG. 4.
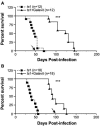
GVT treatment promotes survival in ts1-infected mice. (A) Twenty-four mice were infected with ts1 4 days after birth and then were divided into two groups. Twelve received intraperitoneal injections of GVT, at 250 mg/kg of body weight/day, and the other 12 received the same volume of 0.9% normal saline (infected controls) using the same route. Treatment was continued for 5 days/week and stopped at 50 days p.i. (arrow). At that time, 83% of the mice in the untreated infected control group had died, but all of the GVT-treated mice were alive. ***, P < 0.001. (B) Thirty-six mice were infected with ts1 4 days after birth and then were divided into two groups. Eighteen mice received intraperitoneal injections of GVT, at 125 mg/kg of body weight/day, and the other 18 received 0.9% normal saline (infected controls) by the same route for 5 days per week. In this experiment, treatment was continued until 100 days p.i. (arrow). As shown, all of the mice in the infected untreated control group had died by 55 days p.i., like the infected untreated control mice in panel A. At that time, all of the GVT-treated mice were alive and healthy. When GVT treatment was stopped at 100 days p.i., however, 78% of the animals in this group had died. ***, P < 0.001.
FIG. 5.
FIG. 5.
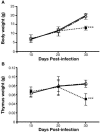
GVT treatment protects against ts1-induced wasting and thymic atrophy. (A) Control uninfected, ts1-infected untreated, and ts1-infected GVT-treated mice (using the 250-mg/kg/day, 5-day/week regimen) were weighed at 10, 20, and 30 days p.i.. Shown are average body weights, ± standard deviations, for three to six animals from the three different groups at each time point. (B) In a parallel experiment, control uninfected, ts1-infected untreated, and ts1-infected GVT-treated mice were sacrificed at 10, 20, and 30 days p.i., at which times thymi from three to six mice were removed and weighed. ***, P < 0.001. ⋄, control; ▪, ts1; ▵, ts1 plus GVT.
FIG. 6.
FIG. 6.
Effects of GVT on CNS histopathology and thymic cytoarchitecture in ts1-infected mice. (A) Paraffin sections of brainstem tissues of normal control (left), ts1-infected untreated (middle), and ts1-infected GVT-treated (right) mice were cut from brainstems taken from mice sacrificed at 30 days p.i. and stained with HE. Note the typical ts1-induced spongiform degeneration (circles) in the brainstem section from the ts1-infected untreated mouse (middle). (B) Paraffin sections of brainstem tissues of normal control (left), ts1-infected untreated (middle), and ts1-infected GVT-treated (right) mice were prepared at 30 days p.i., as described above, and immunostained for the astrocyte marker GFAP. Note that many GFAP-positive astrocytes (brown staining of astrocyte processes) are present in the brainstem section from the ts1-infected untreated mouse (middle). (C) The thymus of the ts1-infected mouse (middle) also shows dramatic thinning and atrophy and has lost its corticomedullary organization. Magnification, (A) ×200; (B) ×400; (C) ×40.
FIG. 7.
FIG. 7.
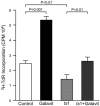
GVT treatment increases DNA synthesis in thymocytes from ts1-infected mice. Thymocytes freshly isolated from uninfected, uninfected GVT-treated, ts1-infected untreated, and ts1-infected GVT-treated mice at 30 days p.i. were cultured in 96-well plates at 37°C for 4 h in the presence of 0.5 μCi of [3H]thymidine. After 4 h, the cells were harvested and [3H]thymidine incorporation into DNA was measured with a scintillation counter. The results are expressed as mean counts per minute plus standard deviation in triplicate cultures.
FIG. 8.
FIG. 8.
GVT treatment suppresses elevation of Nrf2, GPx, and xCT in thymocytes from ts1-infected mice. Thymocytes were isolated from uninfected control, ts1-infected untreated, and ts1-infected GVT-treated mice at 30 days p.i., and lysates were prepared for immunoblotting using antibodies to Nrf2, GPx, and xCT. All blots were stripped and reimmunoblotted with anti-β-actin antibody as a protein-loading control. The results shown are representative of three independent experiments.
FIG. 9.
FIG. 9.
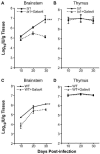
Early GVT treatment (starting at 2 days p.i.) suppresses ts1 replication in the CNS, but not in the thymus. ts1 virus titers were determined at 10, 20, and 30 days p.i. for brainstem (A) and thymus (B) from ts1-infected untreated versus ts1-infected GVT-treated mice. WT virus titers were determined at 10, 20, and 30 days p.i. for brainstem (C) and thymus (D) tissues. The data points represent average viral titers for tissues from three to six mice, ± standard deviation, at each time point. **, P < 0.01. ***, P < 0.001.
FIG. 10.
FIG. 10.
Late GVT treatment (starting at 10 days p.i.) promotes survival in ts1-infected mice without reducing the virus titer in the CNS. Twenty-seven mice were infected with ts1 4 days after birth and then divided into two groups. Fifteen mice received intraperitoneal injections of GVT at 250 mg/kg of body weight/day for 5 days a week, starting at 10 days p.i. The remaining 12 received the same volume of 0.9% normal saline (infected untreated controls) using the same route and on the same schedule. At 30 days p.i., three mice from each group were sacrificed for brainstem ts1 titer determinations. Treatment was continued for the remaining mice for 5 days/week until 50 days p.i., at which time all of the mice in the untreated infected control group had died. At that time, 8 of the 12 GVT-treated mice were alive and asymptomatic (A). Survival curves for untreated infected versus infected mice treated with GVT starting at 10 days p.i. (B) Average brainstem virus titers, plus standard deviations, from three mice taken from the ts1-infected untreated group versus three mice taken from the infected GVT-treated group, whose survival curves appear in panel A.
FIG. 11.
FIG. 11.
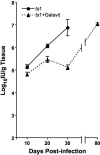
ts1 replication resumes when GVT treatment is terminated. Brainstems were isolated from ts1-infected GVT-treated mice (early treatment protocol), and ts1 titers were determined at 10, 20, and 30 days p.i. GVT treatment was then terminated for the remaining mice in the infected treated group at 50 days p.i., and ts1 titers in their brainstem tissues were determined at 80 days p.i. Each point in the graph represents the average virus titer, ± standard deviation, for three to six mice.
FIG. 12.
FIG. 12.
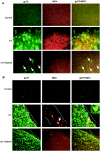
Early GVT treatment protects the brainstem and the thymus from oxidative stress after ts1 infection, although it does not affect ts1 replication in the thymus. Brainstems and thymi from uninfected control mice, ts1-infected untreated mice, and ts1-infected GVT-treated mice were isolated and snap-frozen at 30 days p.i. Sections cut from these brainstems were then immunostained with fluorescently labeled antibody against gp70 (green) and MDA (red) to detect infection (gp70) and MDA-conjugated proteins (MDA), which are products of membrane lipid peroxidation in tissues undergoing oxidative stress. (A) Brainstem sections. (B) Thymus sections. Infected cells (green staining) and MDA adducts (red staining). In the left and right panels of the bottom row in panel A, which show a brainstem section from a GVT-treated ts1-infected mouse, widely scattered, brightly stained gp70-positive (infected) cells are present (arrows), although spongiform lesions are absent. In the middle row in panel B, which shows a thymus section from an untreated ts1-infected mouse, the dotted lines bracket the cortex of one thymic lobule. In the middle and right panels of this row, an arrow identifies a group of cells in the cortex showing heavy red MDA staining, indicative of lipid peroxidation. This group of cells is magnified in the inset in the right panel of this row, where the cells are shown to be infected, as well (green gp70 staining). Magnification, (A) ×400; (B) ×400.
FIG. 13.
FIG. 13.
Possible mechanisms for CNS and thymus protection by GVT. Productive infection by retroviruses generally requires that the target cells be activated. In the CNS, potential ts1 target cells (glial cells, including astrocytes) are quiescent, while ts1 target cells in the thymus (including thymocytes) are naturally proliferating cells. After ts1 inoculation, virus-induced oxidative stress events activate glial cells in the untreated CNS, allowing the virus to spread. If GVT is administered immediately after inoculation, its presence in the CNS may inhibit early cell activation events necessary for ts1 to replicate there. Even if virus infection is already established in the CNS, drug administration at a later time is still neuroprotective, although large amounts of replicating virus are present. Similarly, GVT protects the thymus from ts1-induced oxidative stress, thereby preserving the thymic cytoarchitecture and thymocyte cell division, without reducing ts1 replication. We propose that GVT protects the CNS and thymus against oxidative damage after ts1 infection and that this action of the drug is responsible for its neuroprotective and immunoprotective effects in ts1-induced neuroimmunodegeneration.

Similar articles

Cited by

References

    1. Ball, J., J. A. McCarter, and S. M. Sunderland. 1973. Evidence for helper independent murine sarcoma virus. I. Segregation of replication-defective and transformation-defective viruses. Virology 56:268-284. - PubMed
    1. Ball, J. K., T. Y. Huh, and J. A. McCarter. 1964. On the statistical distribution of epidermal papillomata in mice. Br, J. Cancer 18:120-123. - PMC - PubMed
    1. Barlow, C., P. A. Dennery, M. K. Shigenaga, M. A. Smith, J. D. Morrow, L. J. Roberts II, A. Wynshaw-Boris, and R. L. Levine. 1999. Loss of the ataxia-telangiectasia gene product causes oxidative damage in target organs. Proc. Natl. Acad. Sci. USA 96:9915-9919. - PMC - PubMed
    1. Bensaad, K., and K. H. Vousden. 2005. Savior and slayer: the two faces of p53. Nat. Med. 11:1278-1279. - PubMed
    1. Betteridge, D. J. 2000. What is oxidative stress? Metabolism 49:3-8. - PubMed

Publication types

MeSH terms