. 2006 May;26(9):3565-81.
doi: 10.1128/MCB.26.9.3565-3581.2006.

Essential dosage-dependent functions of the transcription factor yin yang 1 in late embryonic development and cell cycle progression

Affiliations

Essential dosage-dependent functions of the transcription factor yin yang 1 in late embryonic development and cell cycle progression

El Bachir Affar et al. Mol Cell Biol. 2006 May.

Abstract

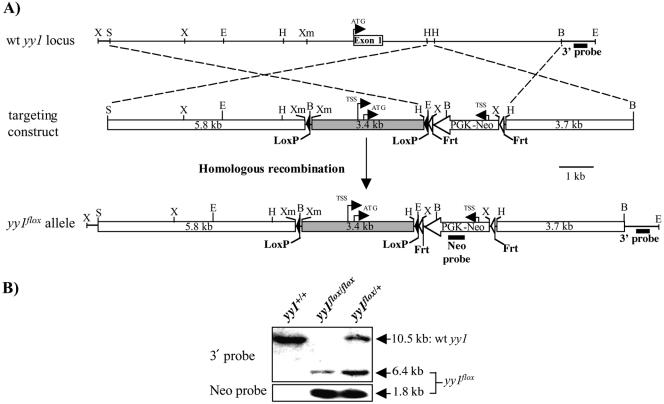
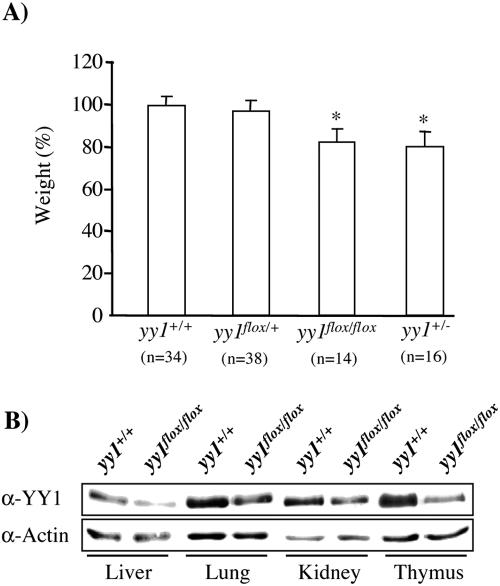
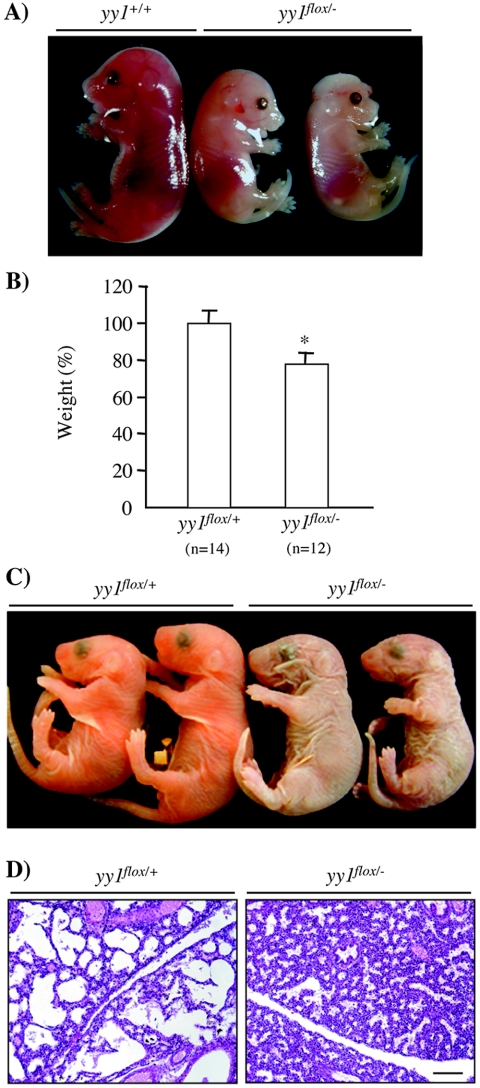
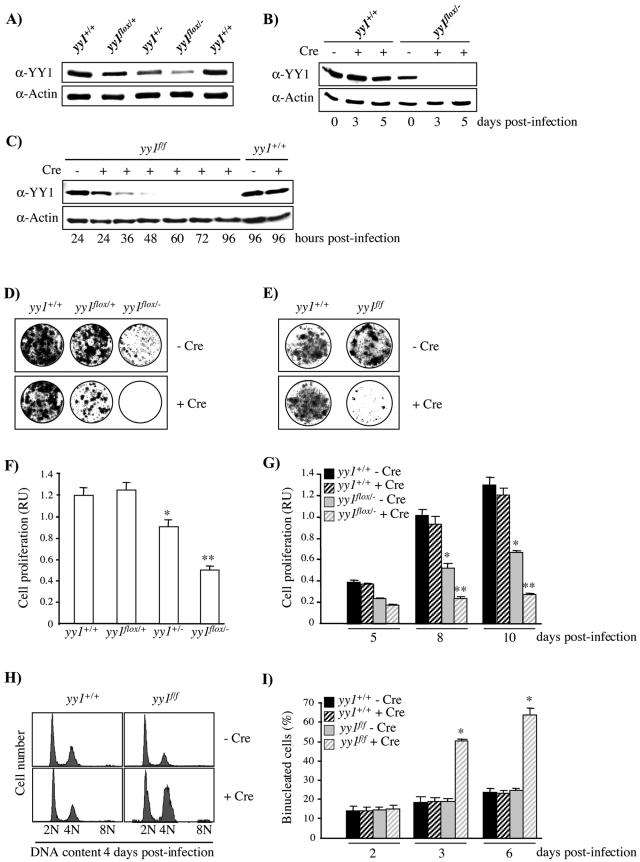
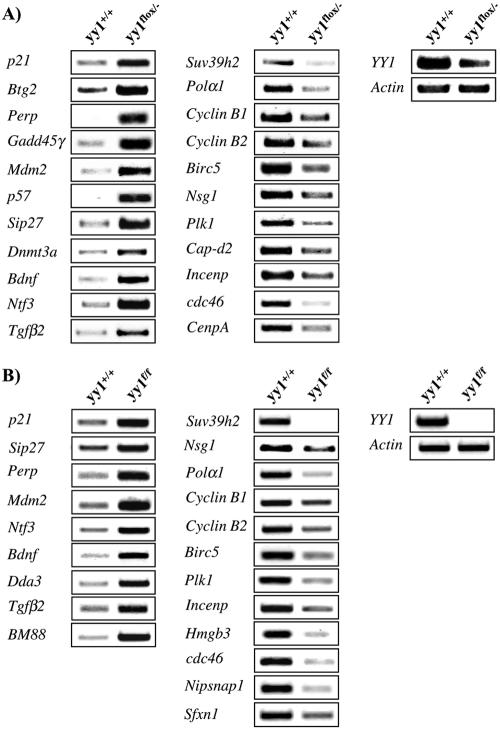
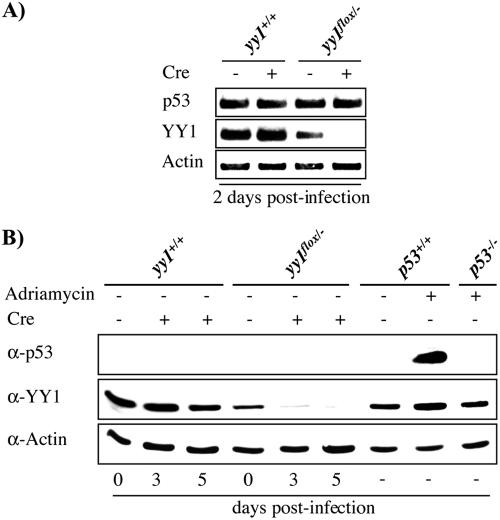
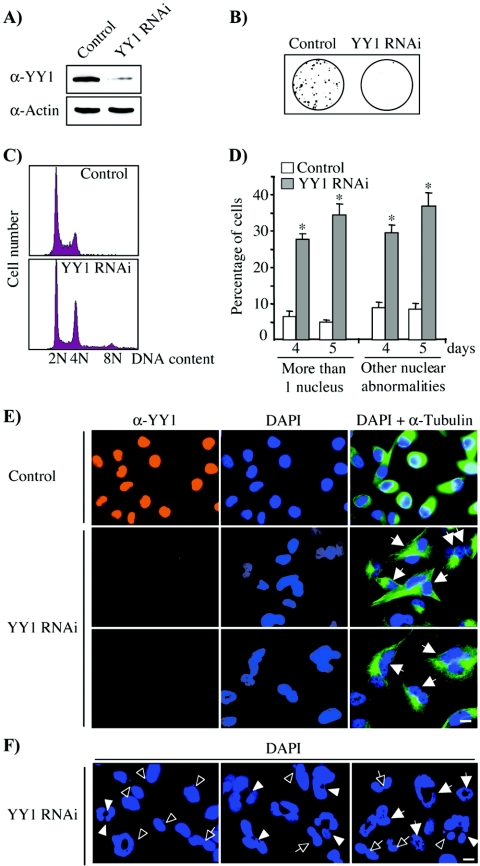
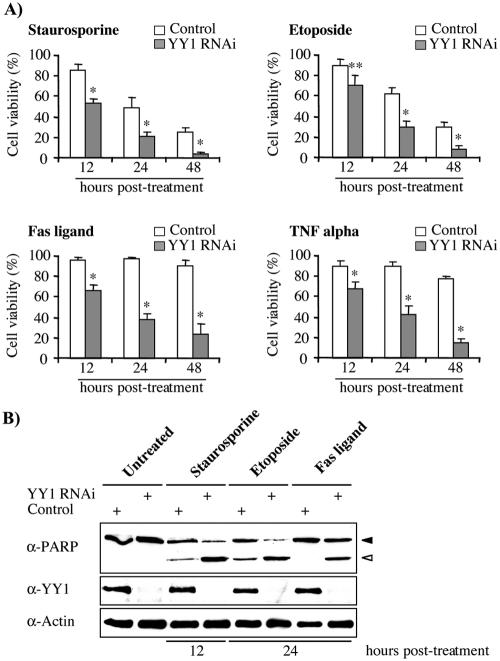
Constitutive ablation of the Yin Yang 1 (YY1) transcription factor in mice results in peri-implantation lethality. In this study, we used homologous recombination to generate knockout mice carrying yy1 alleles expressing various amounts of YY1. Phenotypic analysis of yy1 mutant embryos expressing approximately 75%, approximately 50%, and approximately 25% of the normal complement of YY1 identified a dosage-dependent requirement for YY1 during late embryogenesis. Indeed, reduction of YY1 levels impairs embryonic growth and viability in a dose-dependent manner. Analysis of the corresponding mouse embryonic fibroblast cells also revealed a tight correlation between YY1 dosage and cell proliferation, with a complete ablation of YY1 inducing cytokinesis failure and cell cycle arrest. Consistently, RNA interference-mediated inhibition of YY1 in HeLa cells prevents cytokinesis, causes proliferative arrest, and increases cellular sensitivity to various apoptotic agents. Genome-wide expression profiling identified a plethora of YY1 target genes that have been implicated in cell growth, proliferation, cytokinesis, apoptosis, development, and differentiation, suggesting that YY1 coordinates multiple essential biological processes through a complex transcriptional network. These data not only shed new light on the molecular basis for YY1 developmental roles and cellular functions, but also provide insight into the general mechanisms controlling eukaryotic cell proliferation, apoptosis, and differentiation.


Figures

FIG. 1.
FIG. 1.
Conditional targeted disruption of the mouse yy1 locus. (A) Schematic representation of the mouse yy1 locus and targeting strategy: genomic organization of a 15-kilobase fragment of the wild-type (wt) yy1 allele, the targeting vector, and the targeted yy1flox allele obtained after homologous recombination. In addition to the 5.8-kb and 3.7-kb homology arms, the targeting vector contains a 3.4-kb genomic fragment encompassing the promoter-proximal region, the entire exon 1, as well as part of the first intron of the yy1 locus. The targeting vector also contains two loxP sites (black triangles), a neomycin resistance gene (Neo) driven by the PGK promoter, and two Frt sites (white triangles) flanking the Neo cassette. Restriction enzymes sites: B, BamHI; E, EcoRV; S, SmaI; X, XbaI; H, HindIII; Xm, XmnI. The transcription start site (TSS) and translation start site (ATG) are represented by arrows; the 3′ and Neo hybridization probes used for genotyping and the size of a 1-kilobase fragment are also shown. (B) Identification of the yy1flox targeted allele by Southern blot. Genomic DNAs from wild-type (yy1+/+) and mutant mice were digested with EcoRV or XbaI and subsequently hybridized with the 3′ probe and Neo probe, respectively. The sizes of the fragments corresponding to the wt and yy1flox alleles are indicated in kilobases.
FIG. 2.
FIG. 2.
Hypomorphism of the yy1flox allele. (A) Weight of the conditional knockout mice. Heterozygous yy1flox/+ mice were intercrossed, and the weight of their offspring was determined 3 to 6 weeks after birth. The weight of mice heterozygous for the constitutive yy1 knockout allele (yy1+/) generated from independent crosses is shown as a comparison. Within each litter, the weight of the mutant (yy1flox/+, yy1flox/flox, and yy1+/) mice was expressed as the percentage of the average weight of their wild-type (yy1+/+) littermates of the same sex. Each bar corresponds to the mean ± standard deviation of n mice, with values obtained from several (>5) independent crosses. *, P < 0.001, yy1flox/flox and yy1+/ versus yy1+/+ littermates (Student's t test). (B) YY1 expression in the yy1flox/flox conditional knockout mice. Western blot analysis of YY1 expression level in various organs harvested from 3-week-old homozygous yy1flox/flox mice and their wild-type (yy1+/+) littermates. YY1 was detected with an anti-YY1 (H414) antibody, and an antiactin (MAB1501) antibody was used to verify equal loading of the protein extracts. Densitometry analysis revealed that the YY1 protein level in the liver, lung, kidney, and thymus of the yy1flox/flox mice corresponded to 52%, 46%, 54%, and 46%, respectively, of that detected in tissues isolated from their wild-type littermates.
FIG. 3.
FIG. 3.
Phenotype of the hypomorphic yy1flox/ mice. (A) Morphological appearance of the growth-retarded subset of hypomorphic embryos. Heterozygous yy1flox/+ mice were crossed with yy1+/ mice, and the morphology of their offspring was observed at 17.5 dpc. While the yy1flox/− embryo shown in the middle is representative of most animals within the growth-retarded subset, the rightmost embryo displays more-severe developmental defects observed in only a few embryos. A wild-type (yy1+/+) littermate at the same developmental stage is shown for comparison. (B) Weight of the hypomorphic knockout mice at birth. Homozygous yy1flox/flox mice were crossed with yy1+/ mice, and the weight of their newborn pups was measured. Within each litter, the weight of the yy1flox/− mice was expressed as a percentage of the average weight of their yy1flox/+ littermates, whose weights are indistinguishable from those of their wild-type littermates. Each bar corresponds to the mean ± standard deviation of n embryos, and values were obtained from several (>5) independent crosses. *, P < 0.001, yy1flox/− versus yy1flox/+ littermates (Student's t test). (C) Gross morphology of the yy1flox/− pups at birth. Homozygous yy1flox/flox mice were crossed with yy1+/ mice, and the morphological appearance of their newborn pups was analyzed. Two yy1flox/+ neonates, whose size and appearance are indistinguishable from those of wild-type pups, are shown for comparison. (D). Histological analysis of lungs from yy1flox/− and yy1flox/+ newborn littermates stained with hematoxylin and eosin. Bar, 100 μm.
FIG. 4.
FIG. 4.
Dose-dependent effect of YY1 on cell proliferation in MEFs. (A to C) Western blot analysis of YY1 expression level in MEFs isolated from yy1flox/+, yy1+/, yy1flox/−, and yy1f/f littermates and their wild-type (yy1+/+) littermates. In panels B and C, MEFs were infected with adenovirus-Cre and harvested at various time points postinfection. In all panels, YY1 was detected with an anti-YY1 antibody (H414), and equal loading of the protein extracts was assessed using an antiactin (MAB1501) antibody. Densitometry analysis revealed that the YY1 protein level in yy1flox/+, yy1+/ and yy1flox/− MEFs corresponded to 71%, 54%, and 23%, respectively, of that detected in MEFs isolated from their wild-type littermates. (D and E) Dosage-dependent growth defects of yy1-deficient cells. yy1+/+, yy1flox/+, yy1flox/−, and yy1f/f MEFs were infected with adenovirus-Cre, and their growth properties were analyzed by the colony-forming assay. (F) Growth properties of MEFs expressing different levels of YY1. yy1+/+, yy1flox/+, yy1+/, and yy1flox/− MEFs were subjected to the MTT assay 6 days postisolation. *, P < 0.014, yy1+/ versus yy1+/+ MEFs; **, P < 0.001, yy1flox/− versus yy1+/+ and yy1+/ MEFs (Student's t test, n = 6). (G) Growth kinetics of MEFs after complete depletion of YY1. yy1+/+ and yy1flox/− MEFs were infected with adenovirus-Cre, and cell proliferation was assessed by the MTT assay performed at various time points (5, 8, and 10 days) postinfection. In both panels F and G, the results are expressed in relative units (RU) and correspond to the mean ± standard deviation of three values obtained in a representative experiment. *, P < 0.001, untreated yy1flox/− versus untreated yy1+/+ MEFs; **, P < 0.001, Cre-treated yy1flox/− versus Cre-treated yy1+/+ and untreated yy1flox/− littermates (Student's t test). (H) Cell cycle profile resulting from complete depletion of YY1. MEFs isolated from yy1f/f and yy1+/+ littermates were submitted to FACS analysis 4 days postinfection by adenovirus-Cre. (I) Cytokinesis defects induced by complete depletion of YY1. MEFs isolated from yy1+/+ and yy1f/f littermates were infected with adenovirus-Cre, and the number of cells with more than one nucleus was counted at 2, 3, and 6 days postinfection. Each value corresponds to the mean ± standard deviation of three values obtained in independent experiments in which at least 500 cells per sample were scored. *, P < 0.001, Cre-treated yy1f/f versus Cre-treated yy1+/+ MEFs (Student's t test).
FIG. 5.
FIG. 5.
Confirmation of potential targets of YY1 by semiquantitative RT-PCR. (A) Validation of the microarray data in yy1flox/− MEFs. Eleven genes whose expression was higher in the yy1flox/− MEFs than in their wild-type (yy1+/+) counterparts (Table 2 and Table 1 in the supplemental material) were selected for RT-PCR analysis using RNAs extracted from untreated yy1+/+ and yy1flox/− MEFs 4 days postisolation (left panel). Eleven genes expected to be down-regulated in the mutant cells were also analyzed (middle panel). (B) Deregulation of putative YY1 target genes upon complete depletion of YY1 in MEFs. Nine genes whose expression was induced by partial depletion of YY1 (i.e., untreated yy1flox/− MEFs) were selected for RT-PCR analysis performed on RNAs isolated from Cre-treated yy1+/+ and yy1f/f MEFs at 6 days posttreatment (left panel). The expression of 12 genes expected to be down-regulated upon partial depletion of YY1 was also analyzed (middle panel). In both panels A and B, the YY1 and actin control RT-PCRs are shown in the right panels.
FIG. 6.
FIG. 6.
Depletion of YY1 does not affect p53 expression in MEFs. (A) RT-PCR analysis of p53 mRNA level in MEFs isolated from yy1flox/− mice and their wild-type (yy1+/+) littermates 2 days postinfection with adenovirus-Cre (i.e., 4 days postisolation). The YY1 and actin RT-PCRs are shown as controls. (B) Western blot analysis of p53 protein levels in yy1flox/− and yy1+/+ MEFs was performed at various time points postinfection with adenovirus-Cre, using an anti-p53 antibody (PAB240). Adriamycin treatment (2 μg/ml for 10 h) of wild-type (p53+/+) and p53 null (p53−/−) MEFs was used as a control. Equal loading of the protein extracts and Cre-mediated depletion of YY1 were ensured by using antiactin (MAB1501) and anti-YY1 (H414) antibodies, respectively.
FIG. 7.
FIG. 7.
Depletion of YY1 induces proliferation and cytokinesis defects in HeLa cells. (A) Efficient depletion of YY1 after RNAi in HeLa cells. After cotransfection of a control or YY1 RNAi plasmid with a puromycin resistance-encoding vector, the transfected cells were selected by puromycin treatment, and the expression level of YY1 was assessed by Western blot using an anti-YY1 antibody (H414). Equal loading of the protein extracts was confirmed using a monoclonal antiactin (MAB1501) antibody. (B) Effect of YY1 depletion on cell proliferation. HeLa cells were cotransfected and selected as in panel A, and their growth properties were analyzed by the colony-forming assay. (C) Cell cycle profile induced by depletion of YY1. FACS analysis was performed on HeLa cells cotransfected and selected (as described for panel A) 4 days after transfection with the RNAi plasmids. (D to F) Cytokinesis defects and nuclear abnormalities induced by depletion of YY1. HeLa cells transfected with a control or a YY1 RNAi plasmid were plated on coverslips and analyzed by immunofluorescence using an anti-YY1 antibody (H414; red), DAPI to stain the DNA (blue), and an antibody directed against α-tubulin (B512; green). Representative pictures are shown in panel E, and cells displaying more than one nucleus are indicated by solid arrows. Examples of the nuclear abnormalities induced by inhibition of YY1 (scored as other nuclear abnormalities in panel D) are shown in panel F. These nuclear defects include micronuclei (open arrowheads), DNA bridges (solid arrowheads), bilobed and dumbbell-shaped nuclei (open arrows), and other alterations of the nuclear morphology (solid arrows). Note that this panel is a montage generated by selecting only YY1-negative cells displaying nuclear anomalies. In panels E and F, the bar corresponds to 10 μm. The percentages of cells with more than one nucleus or with nuclear abnormalities were determined 4 and 5 days posttransfection. The results are shown in panel D and correspond to the mean ± standard deviation of three values obtained in independent experiments. Within each experiment, at least 500 cells per sample were scored, with only YY1-negative cells being analyzed in the YY1 RNAi samples. *, P < 0.001, YY1 RNAi versus the control (Student's t test).
FIG. 8.
FIG. 8.
RNAi-mediated depletion of YY1 sensitizes HeLa cells to various apoptotic agents. Puromycin-selected HeLa cells were treated with various apoptotic agents (200 nM of staurosporine, 100 μM of etoposide, 100 ng/ml of Fas ligand, and 10 ng/ml of tumor necrosis factor [TNF] alpha) 4 days after transfection of the control and YY1 RNAi vectors. Cell viability (A) and cell death (B) were then quantified at various time points posttreatment. The results shown in panel A correspond to the mean ± standard deviation of three values obtained in independent transfections, the number of viable cells in the treated control and YY1 RNAi cell populations being expressed as a percentage of that observed in the corresponding untreated samples harvested at the same time points. *, P < 0.01, YY1 RNAi versus control cells; **, P < 0.05, YY1 RNAi versus control cells (Student's t test). Western blot analysis of PARP cleavage was used to determine apoptotic cell death (panel B); full-length PARP and cleavage fragment are indicated by a solid and an open arrowhead, respectively. Efficient depletion of YY1 upon transfection of the RNAi plasmid and equal loading of the total cell extracts were ensured by using anti-YY1 (H10) and antiactin (MAB1501) antibodies.

Similar articles

Cited by

References

    1. Andreassen, P. R., F. B. Lacroix, O. D. Lohez, and R. L. Margolis. 2001. Neither p21WAF1 nor 14-3-3sigma prevents G2 progression to mitotic catastrophe in human colon carcinoma cells after DNA damage, but p21WAF1 induces stable G1 arrest in resulting tetraploid cells. Cancer Res. 61:7660-7668. - PubMed
    1. Atchison, L., A. Ghias, F. Wilkinson, N. Bonini, and M. L. Atchison. 2003. Transcription factor YY1 functions as a PcG protein in vivo. EMBO J. 22:1347-1358. - PMC - PubMed
    1. Austen, M., C. Cerni, J. M. Luscher-Firzlaff, and B. Luscher. 1998. YY1 can inhibit c-Myc function through a mechanism requiring DNA binding of YY1 but neither its transactivation domain nor direct interaction with c-Myc. Oncogene 17:511-520. - PubMed
    1. Austen, M., B. Luscher, and J. M. Luscher-Firzlaff. 1997. Characterization of the transcriptional regulator YY1. The bipartite transactivation domain is independent of interaction with the TATA box-binding protein, transcription factor IIB, TAFII55, or cAMP-responsive element-binding protein (CPB)-binding protein. J. Biol. Chem. 272:1709-1717. - PubMed
    1. Bain, M., and J. Sinclair. 2005. Targeted inhibition of the transcription factor YY1 in an embryonal carcinoma cell line results in retarded cell growth, elevated levels of p53 but no increase in apoptotic cell death. Eur. J. Cell Biol. 84:543-553. - PubMed

Publication types

Substances

LinkOut - more resources