. 2006 Jun;4(6):e170.
doi: 10.1371/journal.pbio.0040170. Epub 2006 Apr 20.

Chromosomal distribution of PcG proteins during Drosophila development

Affiliations

Chromosomal distribution of PcG proteins during Drosophila development

Nicolas Nègre et al. PLoS Biol. 2006 Jun.

Abstract

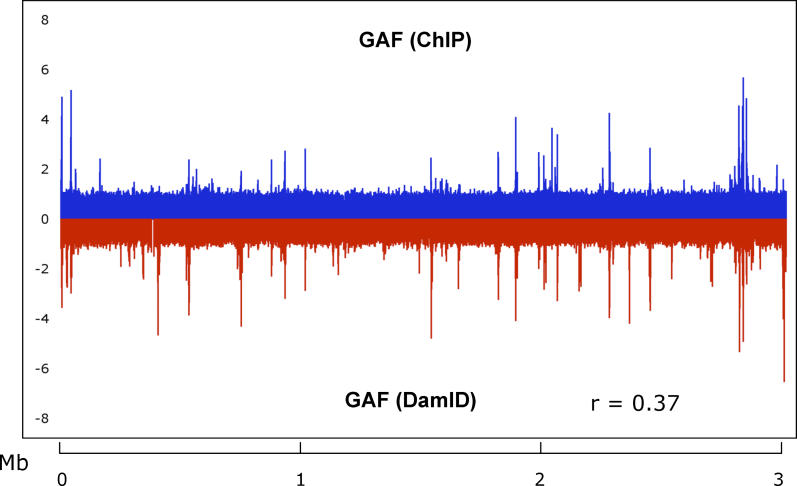
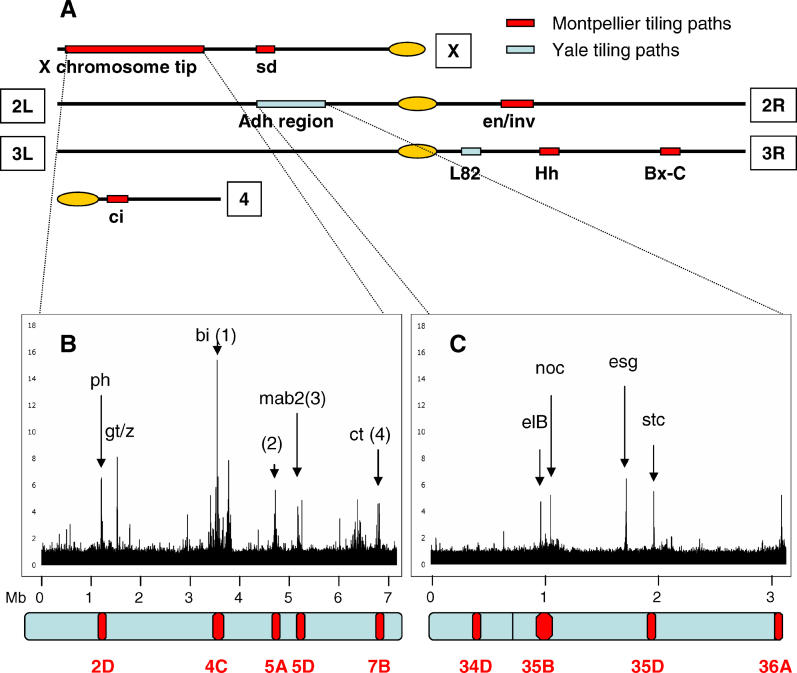
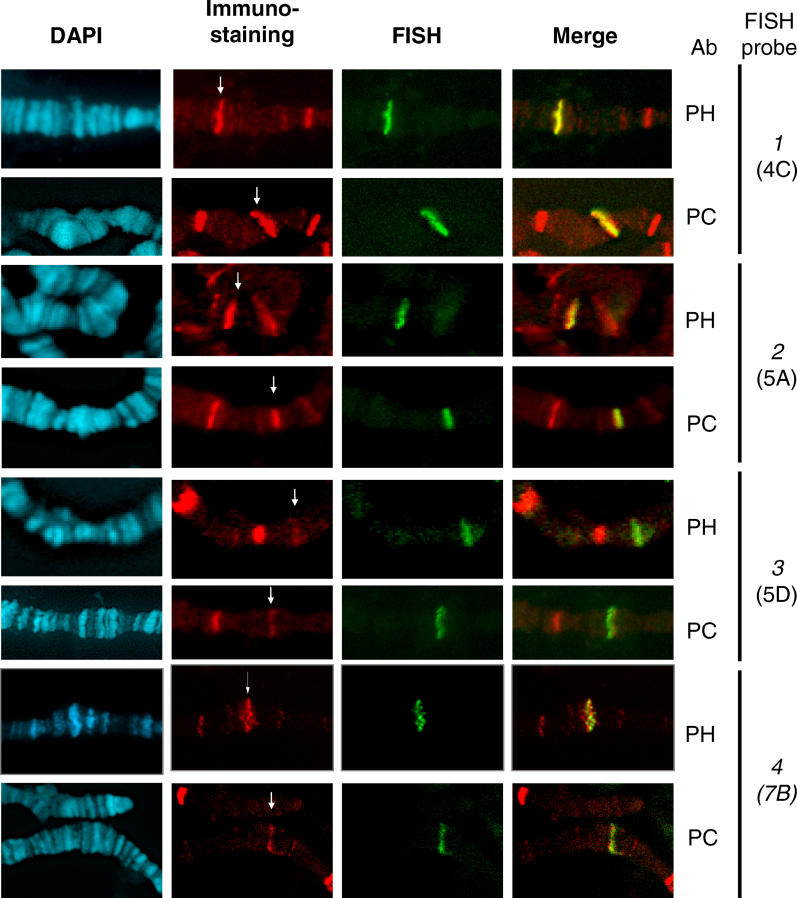
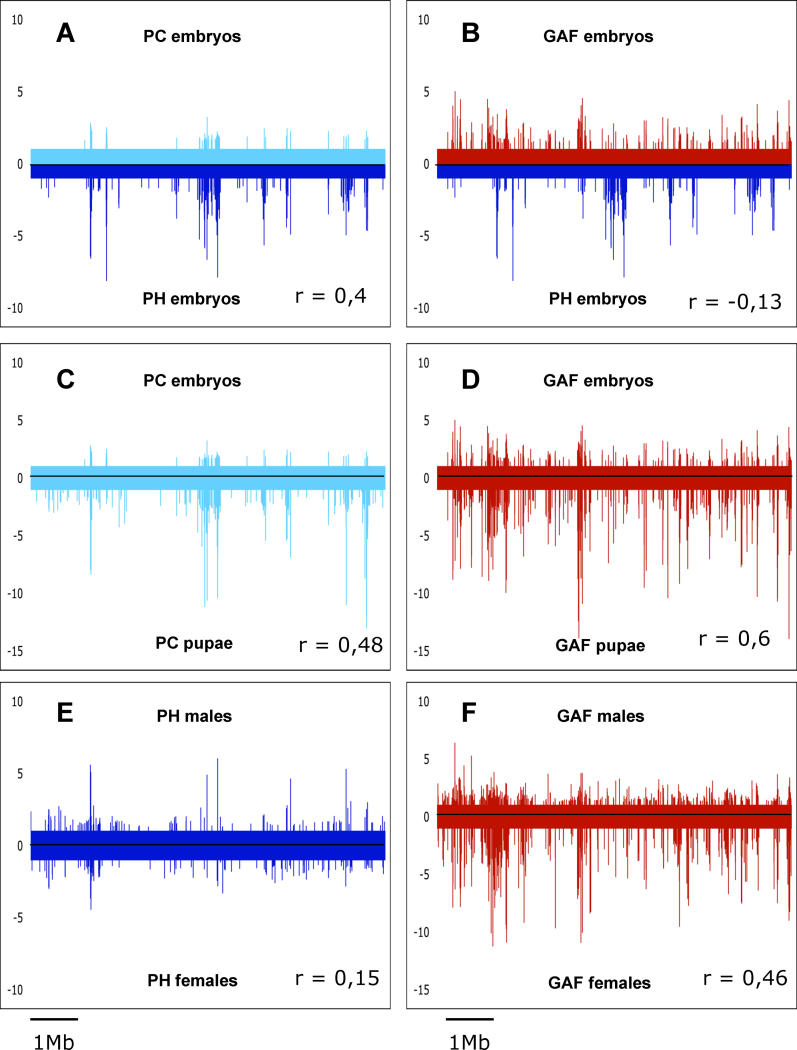
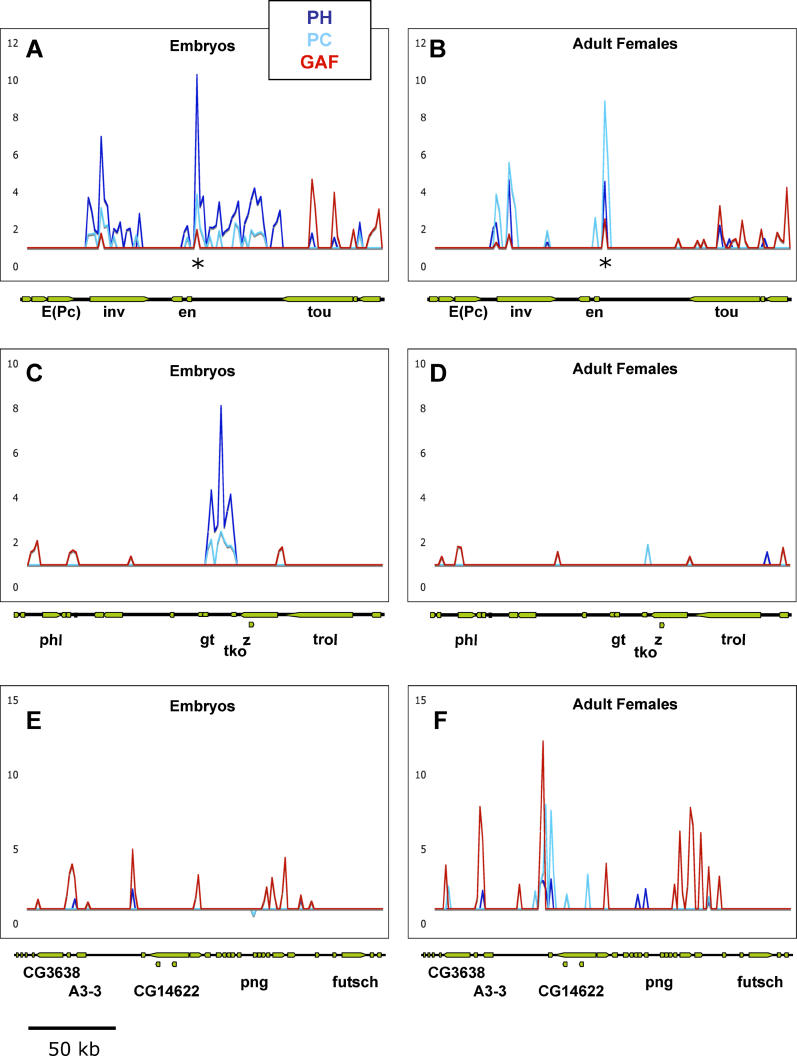
Polycomb group (PcG) proteins are able to maintain the memory of silent transcriptional states of homeotic genes throughout development. In Drosophila, they form multimeric complexes that bind to specific DNA regulatory elements named PcG response elements (PREs). To date, few PREs have been identified and the chromosomal distribution of PcG proteins during development is unknown. We used chromatin immunoprecipitation (ChIP) with genomic tiling path microarrays to analyze the binding profile of the PcG proteins Polycomb (PC) and Polyhomeotic (PH) across 10 Mb of euchromatin. We also analyzed the distribution of GAGA factor (GAF), a sequence-specific DNA binding protein that is found at most previously identified PREs. Our data show that PC and PH often bind to clustered regions within large loci that encode transcription factors which play multiple roles in developmental patterning and in the regulation of cell proliferation. GAF co-localizes with PC and PH to a limited extent, suggesting that GAF is not a necessary component of chromatin at PREs. Finally, the chromosome-association profile of PC and PH changes during development, suggesting that the function of these proteins in the regulation of some of their target genes might be more dynamic than previously anticipated.


Figures

Figure 1
Figure 1. Evaluation of the ChIP Quality
Comparison of protein mapping using ChIP versus DamID. The graph represents the FC of GAF binding on the Adh region obtained by ChIP at the embryonic stage (upper panel in blue) and with DamID in cultured Kc cells as described in [ 40] (lower panel in red). Pearson's correlation coefficient between the two distributions is indicated at the bottom of the graph.
Figure 2
Figure 2. ChIP on Chip Mapping of the PH Protein Using MY Microarrays
(A) Schematic representation of the four Drosophila chromosomes, with the Montpellier tiling path assembly shown in red, and the Yale tiling path regions shown in light blue. (B) The distribution of the PH protein along the tiling path of the X chromosome in Drosophila embryos. Numbers 1 to 4 indicate the regions for which FISH probes used in Figure 3 were designed. The ph locus is a known PcG target that served as a positive control. The other arrows point to the major binding sites. Below the graphs, a scheme of the corresponding chromosomal region is shown; with the cytological location of known PH bands in polytene chromosomes indicated as red ovals. (C) The distribution of the PH protein along the Adh region of Chromosome 2L in Drosophila embryos. Symbols are as in (B).
Figure 3
Figure 3. Immuno-FISH Mapping of PcG Protein Binding at Four Different Target Loci
DAPI labeling of DNA is shown in light blue. The immunostainings of PC and PH (as indicated to the right of each row) are shown in red. DNA FISH staining is shown in green, and the merge of the red and the green channels is shown in right panels. The name and cytological position for each probe is indicated on the right. The numbers identifying the probes used correspond to those indicated in Figure 2. 1 corresponds to the bifid gene locus, 2 to the CG4136 locus, 3 to the mab-2 locus, and 4 to the cut locus. The arrows point to the bands that co-localize with the FISH signal.
Figure 4
Figure 4. Developmental Comparison of the Distribution Profiles of PC, PH, and GAF
PC is shown in light blue, PH in blue, and GAF in red. All signals that are not significantly enriched are set to one in these graphs. Thus, only the significant targets detected by RDAM at FDR 10% are shown. The correlation coefficient for each comparison is indicated above the graph. (A) A comparison between PH and PC at the embryonic stage shows the extensive overlap between the two proteins. (B) A comparison between GAF and PH in embryos shows the fundamentally different distribution profile for the two proteins. (C) Comparison between the distributions of PC in embryos over PC in pupae. (D) Comparison between the distributions of GAF in embryos over GAF in pupae. (E) Comparison between the distribution of PH males versus PH in females. (F) Comparison between the distributions of GAF in males versus GAF in females.
Figure 5
Figure 5. High Resolution Distribution Profiles
GAF profiles are in red, PH in blue, and PC in light blue. Only significantly enriched signals detected by RDAM at a FDR of 10% are represented. Above each graph, the annotated genes of each genome region are shown. (A) Distribution profiles of PC, PH, and GAF in the en/ inv locus at the embryonic stage. (B) Distribution of PC, PH, and GAF in the en/ inv locus at the adult stage (females). The en PRE used as positive control is indicated by an asterisk. (C) Distribution of PC, PH, and GAF in the gt/ z locus at the embryonic stage. (D) Distribution of PC, PH, and GAF in the gt/ z locus in adult females. Note the disappearance of a strong PcG binding site, while GAF remains stable. (E) Distribution of PC, PH, and GAF in the futsch locus in embryos. (F) PC, PH, and GAF in the futsch locus in adult females. Note that a new binding site for PcG that was absent at the embryonic stage appears at the adult stage, while GAF remains stable.
Figure 6
Figure 6. Regulation of Target Genes by PC
In situ hybridizations in WT and in Pc XL5 mutant embryos for the gt and peb genes. The developmental stage of the embryos is indicated on the left. Arrowheads indicate regions of increased or ectopic labeling in Pc mutants compared to WT. (A) gt expression at embryonic stages 9, 10, 11, and 14. (B) peb expression at embryonic stages 9, 10, 11, and 14.

Comment in

Similar articles

Cited by

References

    1. Ringrose L, Paro R. Epigenetic regulation of cellular memory by the Polycomb and Trithorax group proteins. Annu Rev Genet. 2004;38:413–443. - PubMed
    1. McGinnis W, Krumlauf R. Homeobox genes and axial patterning. Cell. 1992;68:283–302. - PubMed
    1. Ng J, Hart CM, Morgan K, Simon JA. A Drosophila ESC-E(Z) protein complex is distinct from other polycomb group complexes and contains covalently modified ESC. Mol Cell Biol. 2000;20:3069–3078. - PMC - PubMed
    1. Cao R, Zhang Y. The functions of E(Z)/EZH2-mediated methylation of lysine 27 in histone H3. Curr Opin Genet Dev. 2004;14:155–164. - PubMed
    1. Min J, Zhang Y, Xu RM. Structural basis for specific binding of Polycomb chromodomain to histone H3 methylated at Lys 27. Genes Dev. 2003;17:1823–1828. - PMC - PubMed

Publication types

MeSH terms