

Comparison of perceived and modelled geographical access to accident and emergency departments: a cross-sectional analysis from the Caerphilly Health and Social Needs Study
- PMID: 16613601
- PMCID: PMC1526712
- DOI: 10.1186/1476-072X-5-16
Comparison of perceived and modelled geographical access to accident and emergency departments: a cross-sectional analysis from the Caerphilly Health and Social Needs Study
Abstract
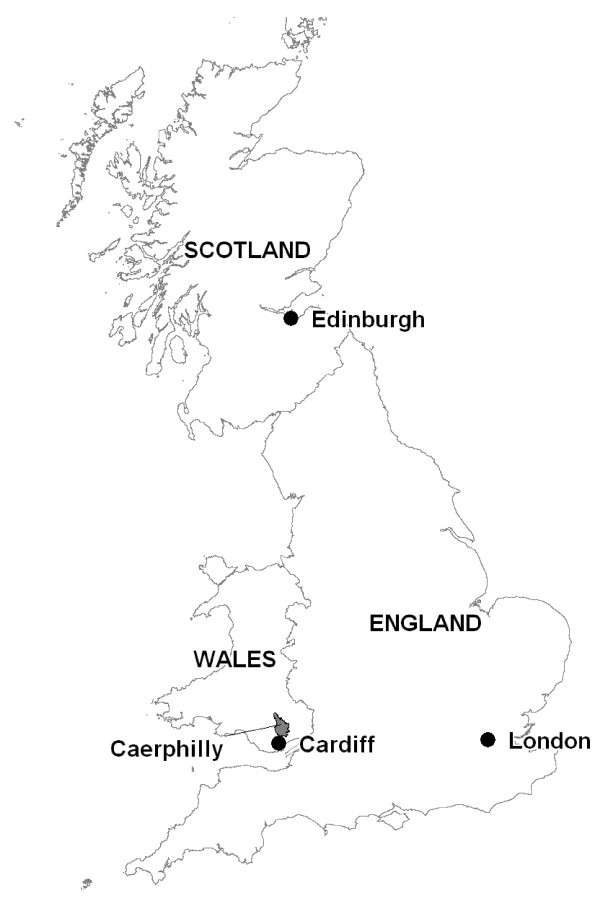
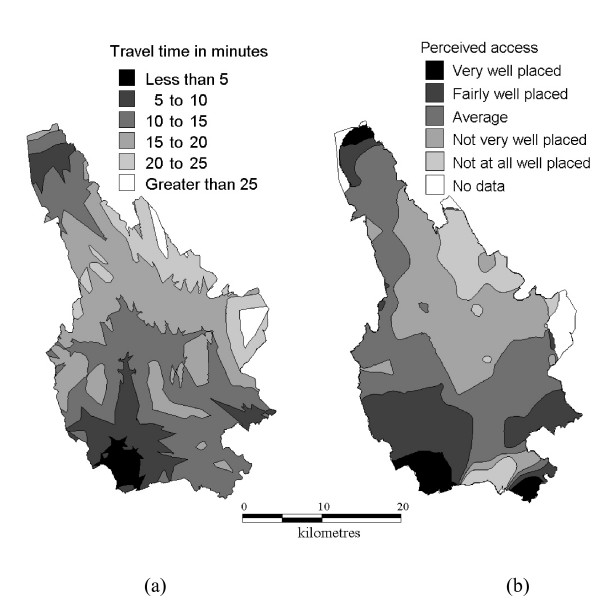
Background: Assessment of the spatial accessibility of hospital accident and emergency departments as perceived by local residents has not previously been investigated. Perceived accessibility may affect where, when, and whether potential patients attend for treatment. Using data on 11,853 respondents to a population survey in Caerphilly county borough, Wales, UK, we present an analysis comparing the accessibility of accident and emergency departments as reported by local residents and drive-time to the nearest accident and emergency department modelled using a geographical information system (GIS).
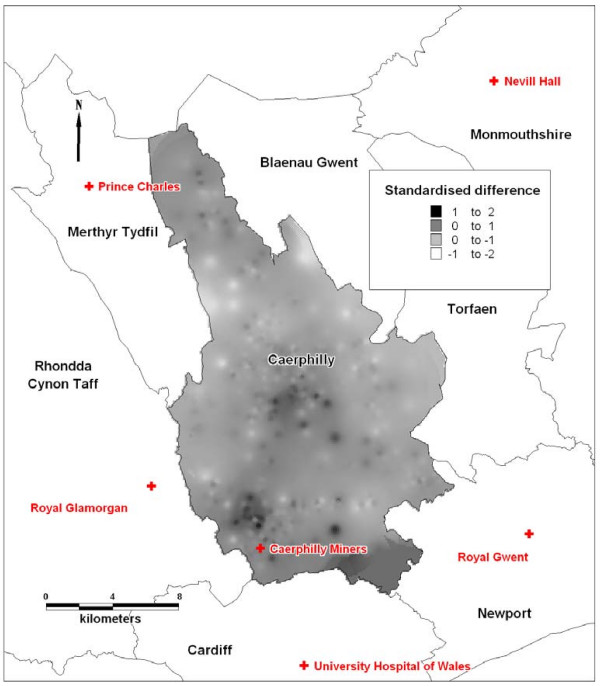
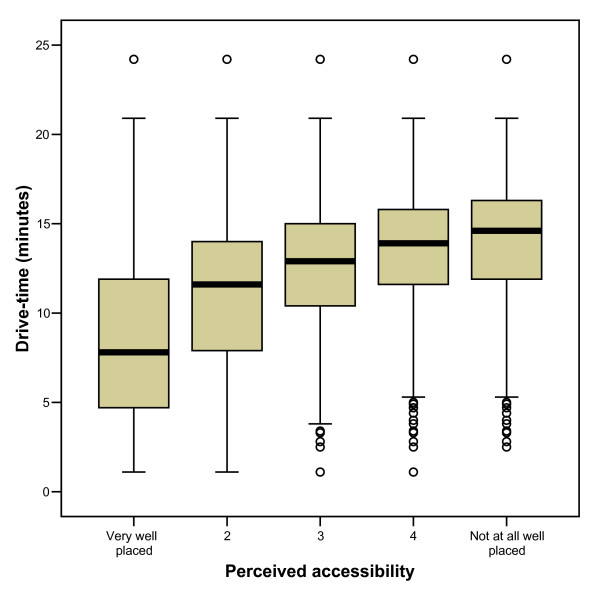
Results: Median drive-times were significantly shorter in the lowest perceived access category and longer in the best perceived access category (p < 0.001). The perceived access and GIS modelled drive-time variables were positively correlated (Spearman's rank correlation coefficient, r = 0.38, p < 0.01). The strongest correlation was found for respondents living in areas in which nearly all households had a car or van (r = 0.47, p < 0.01). Correlations were stronger among respondents reporting good access to public transport and among those reporting a recent accident and emergency attendance for injury treatment compared to other respondents. Correlation coefficients did not vary substantially by levels of household income. Drive-time, road distance and straight-line distance were highly inter-correlated and substituting road distance or straight-line distance as the GIS modelled spatial accessibility measure only marginally decreased the magnitude of the correlations between perceived and GIS modelled access.
Conclusion: This study provides evidence that the accessibility of hospital-based health care services as perceived by local residents is related to measures of spatial accessibility modelled using GIS. For studies that aim to model geographical separation in a way that correlates well with the perception of local residents, there may be minimal advantage in using sophisticated measures. Straight-line distance, which can be calculated without GIS, may be as good as GIS-modelled drive-time or distance for this purpose. These findings will be of importance to health policy makers and local planners who seek to obtain local information on access to services through focussed assessments of residents' concerns over accessibility and GIS modelling.
Figures
References
-
- Department of Health . The NHS Improvement Plan – Putting People at the Heart of Public Services. London: The Stationery Office; 2004. Cm 6268.
-
- Department of Health . Accessibility planning – an introduction for the NHS. London: Department of Health, Health Inequalities Unit; 2004.
-
- Phibbs CS, Luft HS. Correlation of travel time on roads versus straight line distance. Med Care Res Rev. 1995;52:532–542. - PubMed
-
- Roderick P, Clements S, Stone N, Martin D, Diamond I. What determines geographical variation in rates of acceptance onto renal replacement therapy in England? J Health Serv Res Policy. 1999;4:139–146. - PubMed
Publication types
MeSH terms
LinkOut - more resources
Full Text Sources
