Comparative Study
. 2006 Jun 15;573(Pt 3):679-95.
doi: 10.1113/jphysiol.2006.108514. Epub 2006 Apr 13.

Electrophysiological diversity of the dorsal raphe cells across the sleep-wake cycle of the rat

Affiliations
Comparative Study

Electrophysiological diversity of the dorsal raphe cells across the sleep-wake cycle of the rat

Nadia Urbain et al. J Physiol. .

Abstract

Through their widespread projections to the entire brain, dorsal raphe cells participate in many physiological functions and are associated with neuropsychiatric disorders. In previous studies, the width of action potentials was used as a criterion to identify putative serotonergic neurons, and to demonstrate that cells with broad spikes were more active in wakefulness, slowed down their activity in slow wave sleep and became virtually silent during paradoxical sleep. However, recent studies reported that about half of these presumed serotonergic cells were not immunoreactive for tyrosine hydroxylase. Here, we re-examine the electrophysiological properties of dorsal raphe cells across the sleep-wake cycle in rats by the extracellular recording of a large sample of single units (n = 770). We identified two major types of cells, which differ in spike waveform: a first population characterized by broad, mostly positive spikes, and a second one displaying symmetrical positive-negative spikes with a large distribution of spike durations (0.6-3.2 ms). Although we found classical broad-spike cells that were more active in wakefulness, we also found that about one-third of these cells increased or did not change their firing rate during sleep compared with wakefulness. Moreover, 62% of the latter cells were active in paradoxical sleep when most of raphe cells were silent. Such a diversity in the neuronal firing behaviour is important in the light of the recent controversy regarding the neurochemical identity of dorsal raphe cells exhibiting broad spikes. Our results also suggest that the dorsal raphe contains subpopulations of neurons with reciprocal activity across the sleep-wake cycle.


Figures

Figure 1
Figure 1. A coronal section showing the recording site (dark spot indicated by the arrow) in the DRN marked by Pontamine Sky Blue iontophoretic deposit
Horizontal scale bar represents 500 μm.
Figure 2
Figure 2. Raw tracings and the distribution of DRN spike waveform duration
A, 71% of neurons (n = 544) recorded in the medial part of the DRN displayed a broad asymmetrical biphasic spike waveform (AS cells). The first positive part was of great amplitude and the descending part exhibited (Aa) or did not exhibit (Ab) an initial notch, followed by a long duration negative phase of small amplitude. B, a further 29% of cells (n = 226) were characterized by a symmetrical positive–negative spike waveform (SYM cells), which exhibited either a narrow spike (Ba) or a broad spike (Bb). Scale bars: vertical, 1 mV; horizontal, 1 ms. C, histogram of the spike waveform durations of DRN recorded cells. Note the biphasic distribution of the spike durations, indicating two distinct groups of DRN neurons with a large overlap in the spike duration between the two groups.
Figure 3
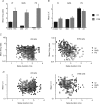
Figure 3. Overall firing properties of DRN neurons across the sleep–wake cycle
A, mean firing rates recorded for each population of DRN cells during each vigilance state. B, mean coefficient of variations (c.v.) in the spike train calculated for each population of DRN cells during each vigilance state. Comparisons between mean firing rates and mean c.v. of the two populations of DRN cells were performed within a same vigilance state by Student's t test for unpaired data. In A and B, *P < 0.001 between the AS and SYM groups. C, scatter plots of the mean firing rates versus the spike duration for AS and SYM cells. Note the inverse relationship between the mean firing rate and spike duration for SYM cells. D, scatter plots of the mean coefficient of variations versus the spike duration for AS and SYM cells. Note the trend of the mean c.v. for SYM cells to decrease as the spike duration increases.
Figure 4
Figure 4. Firing rate properties of AS and SYM cells in W and SWS
A, detailed histograms of rate ratios between W and SWS calculated for AS and SYM cells. Rate ratio was calculated as (W − SWS)/W for W-active neurons and as (SWS − W)/SWS for SWS-active cells (see Methods). Note that a great proportion of AS cells have a rate ratio in the 80–100% range, while these ratios are randomly distributed for SYM cells. B, scatter plots of SWS mean firing rates versus W mean firing rates for each DRN population of cells. Note the difference of scale between AS and SYM cells.
Figure 5
Figure 5. Polygraphic recordings (EMG and EEG) and unit activity of a typical W-active AS DRN neuron across the sleep–wake cycle
A, EMG and EEG recordings and rate histogram (bottom, 1 s binwidth) along successive vigilance states. The weak EMG and the presence of high amplitude slow waves on the EEG are characteristic of SWS in the rat, whereas the tonic muscle activity and the low amplitude fast waves indicate a state of W. Paradoxical sleep is clearly recognizable by a low amplitude EEG in the theta range and a complete loss of muscle tone. This cell exhibited a tonic discharge in W (mean firing rate of 2.03 spikes s−1), decreased its activity in SWS (0.08 spikes s−1) and became silent during the PS episode. The time axis has been cut to show waking from PS (total duration, 265 s). Also shown, on an expanded time scale, are a microarousal episode (B) and a PS to W transition (C) of the same neuron illustrated in A. Note that the cell exhibited in both cases a burst of spikes a few seconds prior to the awakening. During W, the discharge was more or less regular (c.v. = 0.51) and decreased progressively as the rat felt asleep (B).
Figure 6
Figure 6. Polygraphic recordings (EMG and EEG) and unit activity of an AS DRN neuron across the sleep–wake cycle
This W-active AS cells is characterized by a burst firing pattern in W. Asterisks indicate the presence of doublets, and of a triplet for the first burst.
Figure 7
Figure 7. Polygraphic recordings (EMG and EEG) and rate histogram (1 s binwidth) or unit activity of SYM DRN neurons across the sleep–wake cycle
Aa, this typical W-active SYM DRN neuron was active in W (mean firing rate, 1.96 spikes s−1) and ceased to fire in SWS; the time axis has been cut to show the transition towards PS (SWS total duration, 148 s, during which the cell was silent). During PS, the activity of this neuron dramatically increased (mean firing rate, 8.72 spikes s−1); note that the firing rate was also not stable, in that tonic spike trains of sustained activity were separated by episodes of slower activity and sometimes silences (mean PS c.v. = 4.69). Ab, expanded time scale of recordings through W (left) and PS (right) of the neuron illustrated in Aa. Note the local regularity within the spike train during both vigilance states. B, this typical SWS-active SYM DRN cell, particularly slow in W (mean firing rate, 0.17 spikes s−1), started to fire as soon as the rat fell asleep (0.61 spikes s−1) and dramatically increased its activity during the PS episode (7.61 spikes s−1). Note that the discharge rate began to increase prior to the onset of the PS episode. Ca, this typical SYM (W = SWS) DRN neuron exhibited a sustained activity in all vigilance states, with a similar mean firing rate in W and SWS (2.01 and 2.00 spikes s−1, respectively) and a slightly higher discharge in PS (2.22 spikes s−1). Note the highly regular pattern of discharge of this neuron during all the three vigilance states (Cb): SWS c.v. = 0.44, PS c.v. = 0.34 and W c.v. = 0.32.
Figure 8
Figure 8. Relationship between the EEG and spike frequency spectra of SYM units during sleep
A and B show the firing pattern during PS and SWS, respectively, of a typical SYM (SWS-active) DRN on an expanded time scale (5 s of raw data) in the top panels. Below are shown the corresponding power spectral densities (PSD) of the EEG and of the spike train, the autocorrelogram (AC) of the spike train and cross-correlation (CC) between coincident unit activity and EEG as estimated by a spike-triggered averaging technique. AC and CC are plotted for the total episodes of PS and SWS (1120 spikes). Please note that CCs are not plotted with the same amplitude in order to take into account the fact that the PS EEG amplitude is about 2.5 times smaller than the SWS EEG amplitude. During PS (A), the EEG power was highly concentrated in the theta band. This SYM neuron was rhythmically bursting acitivity during PS as shown by clear peaks and troughs on the AC, corresponding to a frequency of 7 Hz on the PSD. The spike train appeared strictly correlated to the coincident EEG activity, as testified by the peak-shaped CC and the strict relationship between the EEG and spike periodograms. The same SYM neuron, recorded in SWS (B), decreased bursting and fired more randomly, as evidenced by a less peak-shaped AC and the flat PSD. The coincident EEG activity was very poorly related to the spike train, as testified by a monotonous CC and the absence of relationship between the EEG and spike periodograms. In the left panel of C are plotted the mean PSD of 6 SYM neurons which exhibited a discharge pattern in the frequency of the theta bands during PS. In the right panel, for the same neurons, during SWS, no relationship between the EEG and spike periodograms could be found.

References

    1. Adrien J, Lanfumey L. Ontogenesis of unit activity in the raphe dorsalis of the behaving kitten: its relationship with the states of vigilance. Brain Res. 1986;366:10–21. - PubMed
    1. Aghajanian GK, Wang RY, Baraban J. Serotonergic and non-serotonergic neurons of the dorsal raphe: reciprocal changes in firing induced by peripheral nerve stimulation. Brain Res. 1978;153:169–175. - PubMed
    1. Allers KA, Sharp T. Neurochemical and anatomical identification of fast- and slow-firing neurones in the rat dorsal raphe nucleus using juxtacellular labelling methods in vivo. Neuroscience. 2003;122:193–204. - PubMed
    1. Artigas F, Romero L, de Montigny C, Blier P. Acceleration of the effect of selected antidepressant drugs in major depression by 5-HT1A antagonists. Trends Neurosci. 1996;19:378–383. - PubMed
    1. Azmitia EC, Segal M. An autoradiographic analysis of the differential ascending projections of the dorsal and median raphe nuclei in the rat. J Comp Neurol. 1978;179:641–667. - PubMed

Publication types

MeSH terms

LinkOut - more resources