Comparative Study
. 2006 Jun 15;573(Pt 3):663-77.
doi: 10.1113/jphysiol.2006.107292. Epub 2006 Apr 13.

Frequency-current relationships of rat hindlimb alpha-motoneurones

Affiliations
Comparative Study

Frequency-current relationships of rat hindlimb alpha-motoneurones

Duane C Button et al. J Physiol. .

Abstract

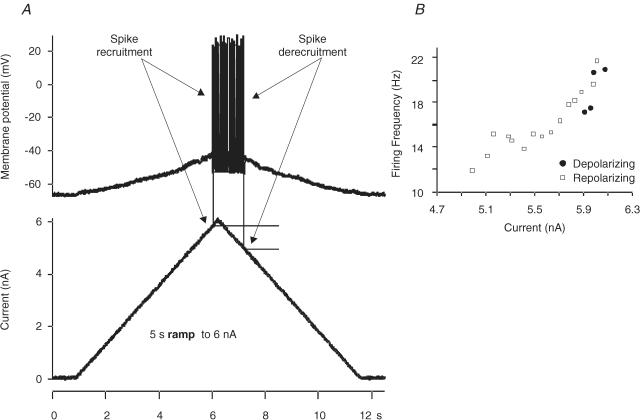
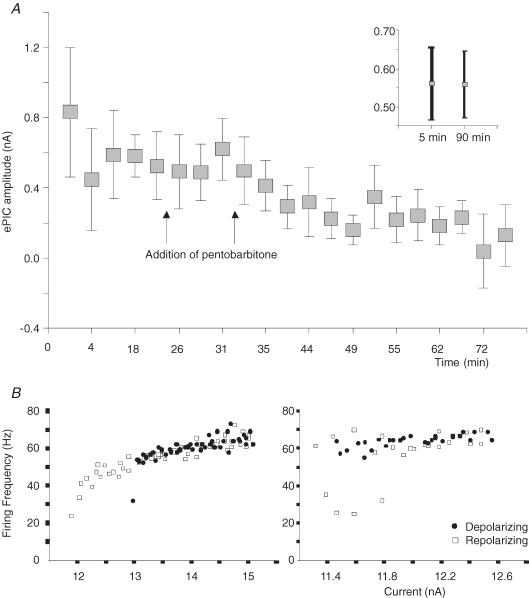
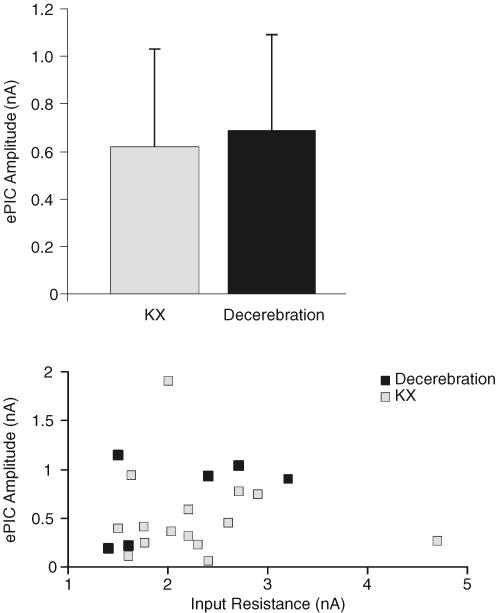
The purpose of this study was to describe the frequency-current (f-I) relationships of hindlimb alpha-motoneurones (MNs) in both anaesthetized and decerebrate rats in situ. Sprague-Dawley rats (250-350 g) were anaesthetized with ketamine and xylazine (KX) or subjected to a precollicular decerebration prior to recording electrophysiological properties from sciatic nerve MNs. Motoneurones from KX-anaesthetized rats had a significantly (P < 0.01) hyperpolarized resting membrane potential and voltage threshold (Vth), increased rheobase current, and a trend (P = 0.06) for a smaller after-hyperpolarization (AHP) amplitude compared to MNs from decerebrate rats. In response to 5 s ramp current injections, MNs could be categorized into four f-I relationship types: (1) linear; (2) adapting; (3) linear + sustained; and (4) late acceleration. Types 3 and 4 demonstrated self-sustained firing owing to activation of persistent inward current (PIC). We estimated the PIC amplitude by subtracting the current at spike derecruitment from the current at spike recruitment. Neither estimated PIC nor f-I slopes differed between fast and slow MNs (slow MNs exhibited AHP half-decay times > 20 ms) or between MNs from KX-anaesthetized and decerebrate rats. Motoneurones from KX-anaesthetized rats had significantly (P < 0.02) hyperpolarized ramp Vth values and smaller and shorter AHP amplitudes and decay times compared to MNs from decerebrate rats. Pentobarbitone decreased the estimated PIC amplitude and almost converted the f-I relationship from type 3 to type 1. In summary, MNs of animals subjected to KX anaesthesia required more current for spike initiation and rhythmic discharge but retained large PICs and self-sustained firing. The KX-anaesthestized preparation enables direct recording of PICs in MNs from intact animals.


Figures

Figure 1
Figure 1. fI relationships determined by using 5 s up–down ramp injections
A, the top trace is the rhythmic discharge of the MN in response to a ramp current (bottom trace). Arrows point to the current at spike recruitment and spike derecruitment. Estimated PIC (ePIC) was calculated by subtracting the current at spike derecruitment from the current at spike recruitment. B is a plot of the instantaneous firing frequency and current from traces in A. In this example, the fI relationship was plotted as an counter-clockwise hysteresis.
Figure 2
Figure 2. A, B, C and D represent four different ramp-induced fI relationship types; left is the raw ramp data and right is the plotted fI relationship
A, type 1 MN fI relationship demonstrates a firing frequency slope that overlaps on the ascending and descending current ramps. B, type 2 MN fI relationship demonstrates a clockwise hysteresis (MN firing rate adaptation). C, type 3 MN fI relationship demonstrates a linear regression line (upper portion of graph) with some self-sustained firing. D, type 4 MN fI relationship demonstrates a counter-clockwise hysteresis or an acceleration of firing just after spike recruitment and below the linear regression line.
Figure 3
Figure 3. Recordings from MNs demonstrating type 3 and 4 fI relationships
Each data point represents the ePIC amplitude of a MN subjected to a series of ramps (minimum of at least three). The grey and white squares represent fast and slow MNs, respectively. The dashed line represents the mean ePIC for all cells. Data points are presented as means ± 1 s.d.
Figure 4
Figure 4. The effect of pentobarbitone on MN ePIC amplitude and fI relationship
A, data were recorded from one MN. Each data point represents the ePIC amplitude average from of a series of ramps (minimum of at least three) at each time period before and after the addition of pentobarbitone. Arrows indicate when pentobarbitone was injected into the rat. The inset indicates that the ePIC does not depend on the time course of the glass microelectrode impalement of the motoneurone. B, left is a graph showing the MN fI relationship (type 3). Its response to a 5 s ramp current injection was measured before the addition of pentobarbitone. Right is a graph demonstrating that upon injection of pentobarbitone, the fI relationship of the MN is almost converted (within 1 h of motoneurone impalement) from fI relationship type 3 to type 1.
Figure 5
Figure 5. Voltage thresholds, AHP amplitudes and AHP ¾ durations measured during the ramp
A, voltages and currents at which rhythmic firing occurred. The horizontal bars and corresponding numbers below the spikes indicate the spikes that were analysed for the Vth and AHP properties. Only fI relationship types 3 and 4 (i.e. ePIC) would include a third horizontal bar and corresponding spike numbers. B, the first two spikes from the ramp in A are shown amplified. The voltage threshold was measured at the point indicated by arrow 1, the amplitude of the AHP is indicated by arrow 2 (the difference between Vth and AHP peak amplitude), and the time it takes for the AHP amplitude to return to ¾ of its baseline valueis indicated by arrow 3. C, illustration of the first and last two spikes (spikes 1, 18 and 19) in the ramp from A. Y axis is the membrane potential, and the spikes are truncated. Spike voltage threshold and after-hyperpolarization values are listed in Table 4.
Figure 6
Figure 6. Each data point represents the current and voltage threshold at each spike and its AHP amplitude and AHP ¾ decay time during the subsequent interspike interval (spikes are not shown here) from the example in Fig. 5A
In this ramp, spike recruitment was induced at 17.4 nA and spike derecruitment occurred at 16.1 nA. During this ramp, the MN discharged a total of 19 spikes (12 of which occurred below the current at which spike recruitment was initiated). Voltage threshold at each spike ranged from −42.7 to −46.5 mV, AHP amplitude ranged from 12 to 16 mV, and the AHP ¾ decay time ranged from 25 to 42 ms.
Figure 7
Figure 7. Illustration of average ePIC and its relation to input resistance
A, comparison of average ePIC amplitude between MNs of KX-anaesthetized and decerebrate rats. Columns represents an average of all ePICs (type 3 and 4 fI relationships only). Data points are presented as means ± 1 s.d. B, relationship between input resistance and ePIC amplitude. Each data point represents one motoneurone. Correlation coefficients were 0.5 for MNs from decerebrate rats and 0.01 for MNs from KX-anaesthetized rats.

References

    1. Alaburda A, Perrier JF, Hounsgaard J. Mechanisms causing plateau potentials in spinal motoneurones. Adv Exp Med Biol. 2002;508:219–226. - PubMed
    1. Beaumont E, Gardiner P. Effects of daily spontaneous running on the electrophysiological properties of hindlimb motoneurones in rats. J Physiol. 2002;540:129–138. - PMC - PubMed
    1. Beaumont E, Gardiner PF. Endurance training alters the biophysical properties of hindlimb motoneurons in rats. Muscle Nerve. 2003;27:228–236. - PubMed
    1. Bennett DJ, Li Y, Siu M. Plateau potentials in sacrocaudal motoneurons of chronic spinal rats, recorded in vitro. J Neurophysiol. 2001;86:1955–1971. - PubMed
    1. Brownstone RM, Jordan LM, Kriellaars DJ, Noga BR, Shefchyk SJ. On the regulation of repetitive firing in lumbar motoneurones during fictive locomotion in the cat. Exp Brain Res. 1992;90:441–455. - PubMed

Publication types