

Meta-Analysis
doi: 10.1073/pnas.0509038103.
Epub 2006 Apr 13.
Element interactions limit soil carbon storage
Affiliations
- PMID: 16614072
- PMCID: PMC1458924
- DOI: 10.1073/pnas.0509038103
Item in Clipboard
Meta-Analysis
Element interactions limit soil carbon storage
Proc Natl Acad Sci U S A.
.
Abstract
Rising levels of atmospheric CO2 are thought to increase C sinks in terrestrial ecosystems. The potential of these sinks to mitigate CO2 emissions, however, may be constrained by nutrients. By using metaanalysis, we found that elevated CO2 only causes accumulation of soil C when N is added at rates well above typical atmospheric N inputs. Similarly, elevated CO2 only enhances N2 fixation, the major natural process providing soil N input, when other nutrients (e.g., phosphorus, molybdenum, and potassium) are added. Hence, soil C sequestration under elevated CO2 is constrained both directly by N availability and indirectly by nutrients needed to support N2 fixation.
Conflict of interest statement
Conflict of interest statement: No conflicts declared.
Figures
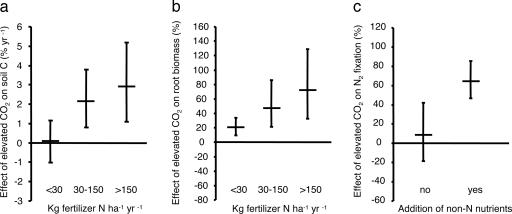
The effect of elevated CO2 on soil C contents, root biomass, and N2 fixation. (a) Change in soil C contents as affected by N fertilization. There is a significant difference between N fertilization classes (P = 0.02). The values for <30, 30–150, and >150 kg·ha−1·yr−1 of N are based on 43, 25, and 12 observations, respectively. (b) Change in root biomass as affected by N fertilization. There is a significant difference between N fertilization classes (P = 0.03). The values for <30, 30–150, and >150 kg·ha−1·yr−1 of N are based on 29, 17, and 10 observations, respectively. (c) Change in N2 fixation as affected by nutrient additions. There is a significant difference between studies that received additional non-N nutrients (43 observations) and studies that did not (49 observations) (P = 0.02). All observations are weighted by experiment duration and number of replicates. All error bars represent 95% confidence intervals.
References
-
- Schimel D. S. Glob. Change Biol. 1995;1:77–91.
-
- Mooney H. A., Drake B. G., Luxmoore R. J., Oechel W. C., Pitelka L. F. Bioscience. 1991;41:96–104.
-
- Gifford R. M. Aust. J. Plant Physiol. 1994;21:1–15.
-
- Hungate B. A., Dukes J. S., Shaw R., Luo Y., Field C. B. Science. 2003;302:1512–1513. - PubMed
-
- Rastetter E. B., #x00C5;gren G. I., Shaver G. R. Ecol. Appl. 1997;7:444–460.
Publication types
MeSH terms
Substances
LinkOut - more resources
Full Text Sources
