. 2006 Apr 25;103(17):6495-9.
doi: 10.1073/pnas.0507134103. Epub 2006 Apr 13.

Defocused orientation and position imaging (DOPI) of myosin V

Affiliations

Defocused orientation and position imaging (DOPI) of myosin V

Erdal Toprak et al. Proc Natl Acad Sci U S A. .

Abstract

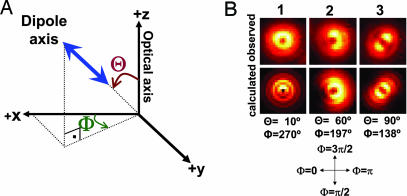
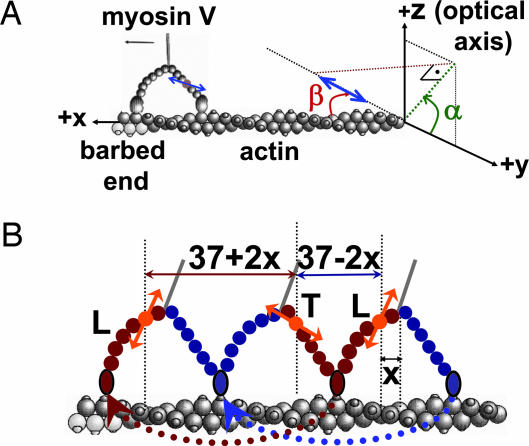
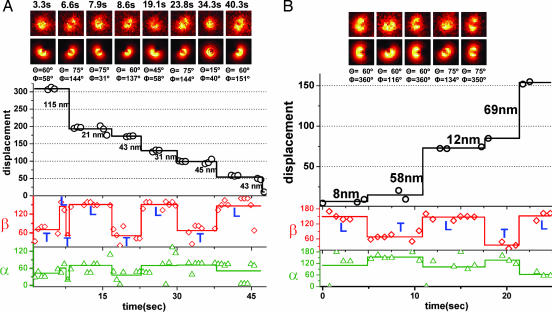
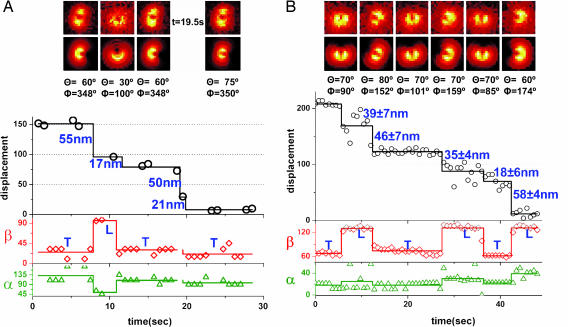
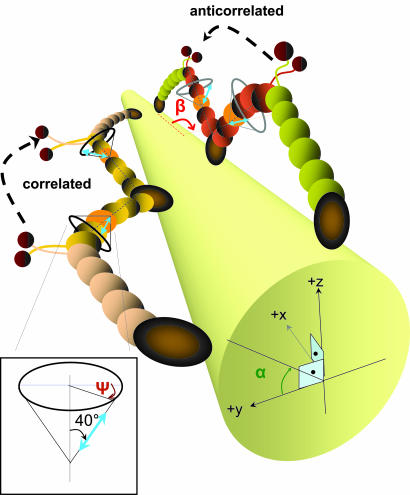
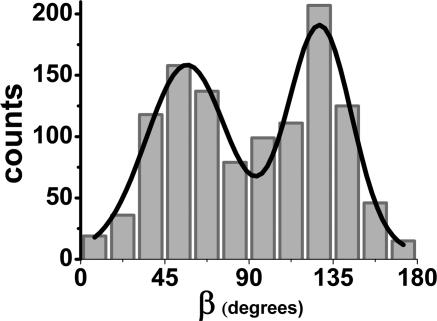
The centroid of a fluorophore can be determined within approximately 1.5-nm accuracy from its focused image through fluorescence imaging with one-nanometer accuracy (FIONA). If, instead, the sample is moved away from the focus, the point-spread-function depends on both the position and 3D orientation of the fluorophore, which can be calculated by defocused orientation and position imaging (DOPI). DOPI does not always yield position accurately, but it is possible to switch back and forth between focused and defocused imaging, thereby getting the centroid and the orientation with precision. We have measured the 3D orientation and stepping behavior of single bifunctional rhodamine probes attached to one of the calmodulins of the light-chain domain (LCD) of myosin V as myosin V moves along actin. Concomitant with large and small steps, the LCD rotates and then dwells in the leading and trailing position, respectively. The probe angle relative to the barbed end of the actin (beta) averaged 128 degrees while the LCD was in the leading state and 57 degrees in the trailing state. The angular difference of 71 degrees represents rotation of LCD around the bound motor domain and is consistent with a 37-nm forward step size of myosin V. When beta changes, the probe rotates +/-27 degrees azimuthally around actin and then rotates back again on the next step. Our results remove degeneracy in angles and the appearance of nontilting lever arms that were reported.


Conflict of interest statement

Conflict of interest statement: No conflicts declared.

Figures

Fig. 1.
Fig. 1.
Right-handed spherical coordinate system and sample defocused patterns in DOPI. (A) Right-handed spherical coordinate system where the z axis is the optical axis, Θ is the axial angle relative to the z axis (0 ≤ Θ ≤ 90°), and Φ is the azimuthal angle around the z axis (0 ≤ Φ ≤ 360°). Note that a dipole always has an inherent degeneracy regardless of the detection method, i.e., (Θ, Φ) is equivalent to (180° − Θ, Φ − 180°). (B) Defocused images of quantum dots (frozen in 1% polyvinyl alcohol) showing examples of vertical, inclined, and parallel emission dipoles (Upper) and corresponding theoretical calculated patterns (Lower). The observed pattern is donut shaped when the emission dipole is along the z axis, i.e., perpendicular to the sample plane (Θ = 0°). It has two lobes when the emission dipole is in the x-y plane, i.e., parallel to the sample plane (Θ = 90°). The pattern is a combination of a donut and two lobes if the emission dipole is inclined. The dark line between the two lobes can be tracked to visualize the in-plane angle (Φ is opposite to the dark region when the objective is moved away from the sample in an inverted microscope).
Fig. 2.
Fig. 2.
The actin-based coordinate system and the relative orientation of actin, myosin V, and dye. (A) The actin-based coordinate system that is necessary to interpret myosin V motions. For example, tilting of the lever arm because of the power stroke is observed as an azimuthal rotation around the optical axis (change in Φ) when myosin is on the side of the actin and as a rotation relative to the optical axis (Θ) when the myosin V is on top of the actin. In the actin-based coordinate system in which α (0 ≤ α ≤ 180°) is the azimuthal angle around actin axis, and β (0 ≤ β ≤ 180°) is the axial angle around the actin axis, these motions correspond to changes in β if the molecule is on the top or side of actin. (B) Cartoon diagram of two consecutive steps of myosin V walking toward the barbed end of actin for which x is the distance between the BR and the midpoint of the MDs. Thus, the sizes for consecutive steps are 37 − 2x and 37 + 2x. The lever arm is in the leading state after a long step of 37 + 2x nm (shown with red double-headed arrow) and is in the trailing state after a short step of 37 − 2x nm (shown with blue double-headed arrow). The orange double arrows show the emission dipole of the BR. The angle between the dipole axis and barbed end of actin (β) is expected to take on smaller values after short steps and larger values after long steps.
Fig. 3.
Fig. 3.
Displacement and 3D orientation of two different myosin V molecules showing ≈44–30 nm and ≈64–10 nm stepping. (A) A sample trace of a myosin V molecule that was imaged by switching between focused and defocused imaging. The exposure time per frame is 0.66 s. We have captured repeated cycles of five consecutive defocused images and three focused images. The sample is moved away from the best focus by 500 nm. Black circles, raw position data analyzed by FIONA; black lines, averaged position within each dwelling period; red diamonds, raw β values analyzed by DOPI; red lines, dwell-averaged β values; green triangles, raw α values; green lines, dwell-averaged α values. The patterns above the graph are representative defocused images for each dwell time and the corresponding theoretically calculated patterns. Φactin = 340°. (B) A sample trace of a myosin V molecule, imaged by switching between focused and defocused imaging. The exposure time is 0.75 s, and we have captured cycles of consecutive four defocused images and two focused images. Note that angular data points at t = 18.75 s are not shown because the image was in a transition stage from focused to defocused image. The sample is moved away from the focus by 500 nm. Φactin = 180°.
Fig. 4.
Fig. 4.
Displacement and 3D orientation trajectories of two different myosin V molecules, showing ≈53–19 nm and ≈44–32 nm stepping. (A) A sample trace of a myosin V molecule that was imaged by switching between focused and defocused imaging. The exposure time is 0.75 s, and we have captured cycles of consecutive four defocused images and two focused images. For the step at t = 19.5 s, the image of BR is focused; therefore, the position is available, but not the orientation. The position information at t = 9.75 s is not shown because the image was shifting due to defocused-to-focused imaging. The sample is moved away from the focus by 500 nm. Φactin = 0°. (B) A sample trace of a myosin V molecule that was imaged by pure defocused imaging (DOPI). The exposure time is 0.75 s, and the sample is moved away from focus by 500 nm. Φactin = 24°.
Fig. 5.
Fig. 5.
Cartoon showing the estimated geometries of LCD–actin for the molecules in Fig. 3 A (correlated) and B (anticorrelated). The actin is represented by a cylinder, and the dipoles are shown in blue. The angle between the lever-arm axis and the dipole axis is ≈40°, and the azimuthal angle of the dipole axis around the lever-arm axis is variable for different CaM positions. Labeled light chains are shown in orange.
Fig. 6.
Fig. 6.
Histogram of the dwell-averaged β values for moving myosin V molecules in the presence of ≈300 nM ATP. A total of 1,151 tilting events are observed for 97 myosin V molecules, and the resulting histogram is fit into a two-peaked Gaussian function (r2 = 0.945). The peak with the lower value (β1 = 57°) corresponds to the trailing state, and the peak with the higher value (β2 = 128°) corresponds to the leading state. The standard deviation is 22° for β1 and 17° for β2.

References

    1. Yildiz A., Forkey J. N., McKinney S. A., Ha T., Goldman Y. E., Selvin P. R. Science. 2003;300:2061–2065. - PubMed
    1. Yildiz A., Tomishige M., Vale R. D., Selvin P. R. Science. 2004;303:676–678. - PubMed
    1. Kural C., Kim H., Syed S., Goshima G., Gelfand V. I., Selvin P. R. Science. 2005;308:1469–1472. - PubMed
    1. Forkey J. N., Quinlan M. E., Shaw M. A., Corrie J. E., Goldman Y. E. Nature. 2003;422:399–404. - PubMed
    1. Bartko A. P., Dickson R. M. J. Phys. Chem. B. 1999;103:3053–3056.

Publication types

LinkOut - more resources