. 2006 Oct 15;108(8):2632-41.
doi: 10.1182/blood-2005-09-3902. Epub 2006 Apr 13.

Molecular strategies for detection and quantitation of clonal cytotoxic T-cell responses in aplastic anemia and myelodysplastic syndrome

Affiliations

Molecular strategies for detection and quantitation of clonal cytotoxic T-cell responses in aplastic anemia and myelodysplastic syndrome

Marcin W Wlodarski et al. Blood. .

Abstract

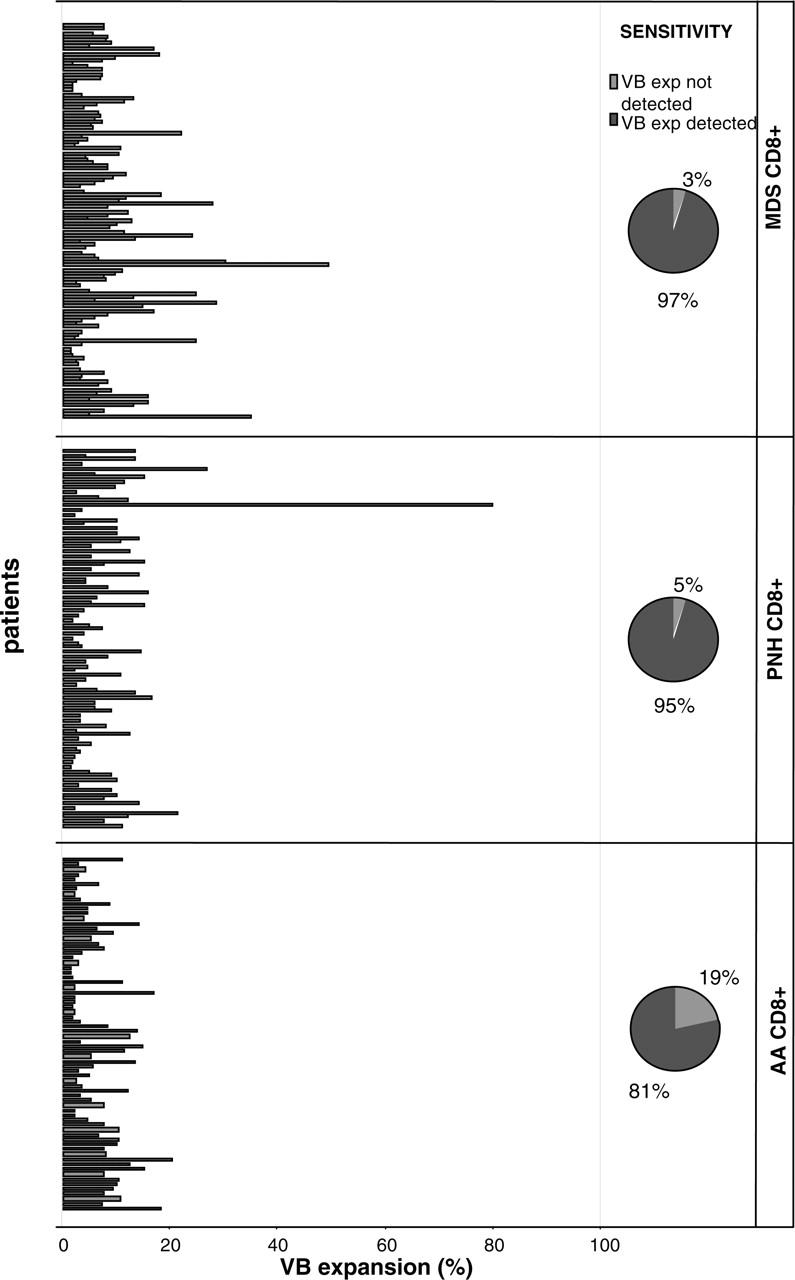
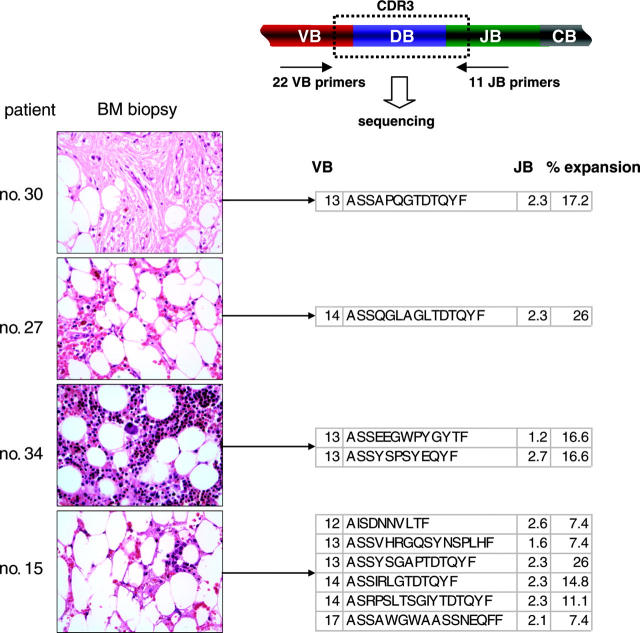
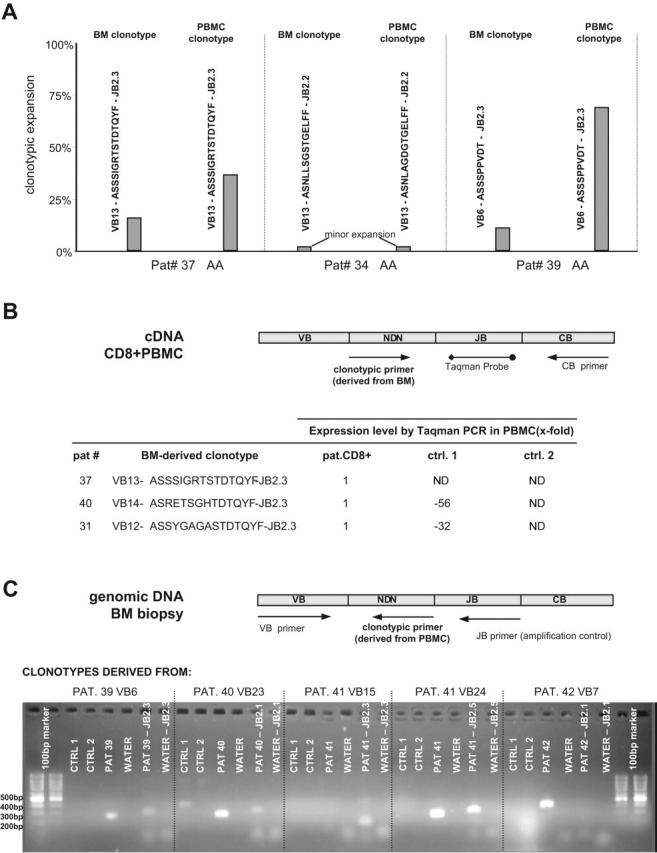
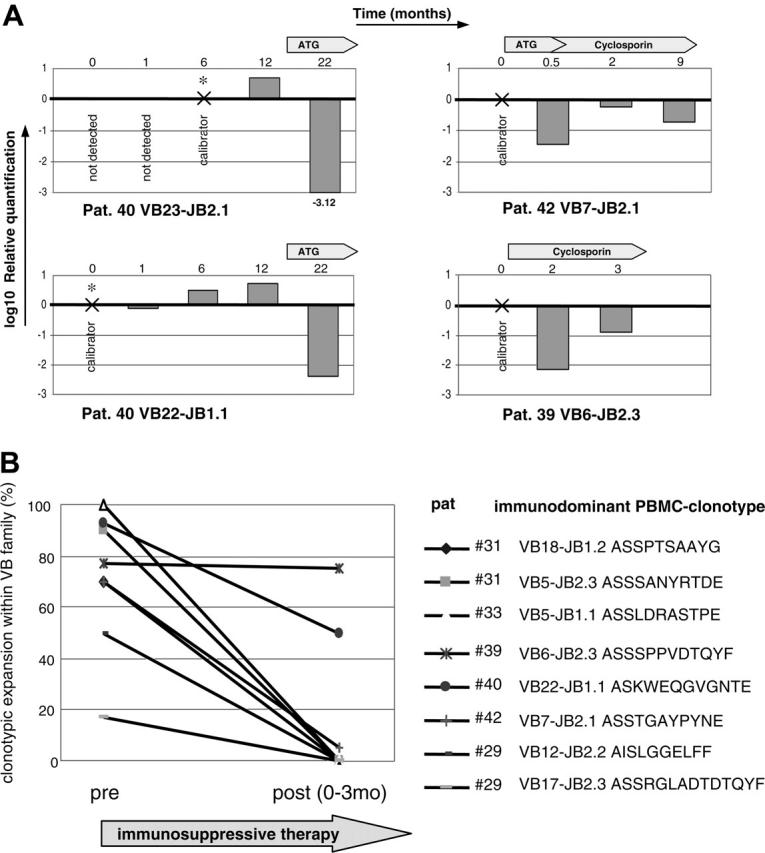
Immune mechanisms are involved in the pathophysiology of aplastic anemia (AA) and myelodysplastic syndrome (MDS). Immune inhibition can result from cytotoxic T cell (CTL) attack against normal hematopoiesis or reflect immune surveillance. We used clonally unique T-cell receptor (TCR) variable beta-chain (VB) CDR3 regions as markers of pathogenic CTL responses and show that while marrow failure syndromes are characterized by polyclonal expansions, overexpanded clones exist in these diseases and can serve as investigative tools. To test the applicability of clonotypic assays, we developed rational molecular methods for the detection of immunodominant clonotypes in blood and in historic marrow biopsies of 35 AA, 37 MDS, and 21 paroxysmal nocturnal hemoglobinuria (PNH) patients, in whom specific CDR3 sequences and clonal sizes were determined. CTL expansions were detected in 81% and 97% of AA and MDS patients, respectively. In total, 81 immunodominant signature clonotypes were identified. Based on the sequence of immunodominant CDR3 clonotypes, we designed quantitative assays for monitoring corresponding clones, including clonotypic Taqman polymerase chain reaction (PCR) and clonotype-specific sequencing. No correlation was found between clonality and disease severity but in patients treated with immunosuppression, truly pathogenic clones were identified based on the decline that paralleled hematologic response. We conclude that immunodominant clonotypes associated with marrow failure may be used to monitor immunosuppressive therapy.


Figures

Figure 1.
Figure 1.
Patients with immunodominant expansions of TCR VB families. The size of pathologic VB expansion was calculated based on the values obtained from healthy controls and was defined as greater than 2 SDs above the normal values. The figure shows significant expansions of single CTL VB families in 4 patient groups. The pie diagrams depict the detection rate of immunodominant clonal expansions.
Figure 2.
Figure 2.
Examples of the application of TCR multiplex PCR for detection of immunodominant clonotypes in BM biopsies. Multiplex VB PCR combined with clonotype sequencing allowed for the detection of immunodominant clonotypic expansions in archived bone marrow biopsies. VB indicates T-cell receptor VB chain; CDR3, complementarity determining region 3; JB, joining region of the TCR B chain; and CB, constant B chain. All immunodominant BM-derived clonotypes are shown in Table 7. Images were obtained via digital microscopy using an Olympus BX41 microscope (Olympus America, Melville, NY) equipped with a 40×/0.75 NA UPlan objective lens. Slides were stained with hematoxylin and eosin. Images were captured using a Digital Camera Model no. 11.2 Color Mosaic (Diagnostic Instruments, Sterling Heights, MI), and imaging software included Spot Basic 4.1.3 (Diagnostic Instruments).
Figure 3.
Figure 3.
Molecular tracking of immunodominant clonotypes in BM biopsies and peripheral blood CD8+ cells from AA/MDS patients. (A) Independent sequencing of CDR3 regions derived from BM biopsy DNA and peripheral blood CD8+ RNA revealed identical or highly homologous clonotypes. Three examples are shown: in patients no. 37 and no. 39, identical expanded clonotypes were detected in both archived tissue and peripheral blood; patient no. 34 harbors 2 highly homologous minor clonotypes. PBMC indicates peripheral blood mononuclear cell. (B) The presence of clonotypes identified in archival BM tissue was tested on RNA from peripheral blood CD8+ cells using a quantitative Taqman assay. The presence and quantity of each shown clonotype was tested in the original patient and 2 healthy control samples obtained from our laboratory. Expression level in controls is shown as fold decrease in comparison to patient's values, which served as calibrator. ND indicates not detected. (C) Detection of blood-derived clonotypes in BM biopsies using nonquantitative clonotypic PCR. We were able to amplify peripheral blood-specific clonotypes in patient BM biopsies. Each clonotype was tested on genomic DNA from patient BM and genomic DNA from healthy controls. The primer set VB forward - JB reverse was used as an endogenous amplification control. The clonotypic primer derived from patient no. 40 also amplifies a nonspecific product of unexpected length in Ctrl1, possibly suggesting a partially rearranged TCR with high homology to patient's TCR sequence.
Figure 4.
Figure 4.
Effect of immunosuppressive therapy on TCR repertoire in AA patient. (A) For the tracking of potentially pathogenic clones, a clonotypic Taqman PCR was performed using patient CDR3-specific forward primers, CDR3-specific JB probe, and CB reverse primer. Four immunodominant clones were tracked during the course of disease in 3 AA patients. RNA was extracted from sorted CD8+ cells. For the calculation of clonotypic expression, samples in which the original immunodominant clonotype was identified were used as calibrators for subsequent or retrospective measurements. GAPDH levels were used for the normalization of RNA amounts. (B) TCR repertoire analysis was performed on 7 patients before and after application of immunosuppressive therapy that is shown in Table 3. AA patient no. 31 was analyzed before and after therapy, and 2 dominant clonotypes were found for VB5 and VB18 with the frequencies of 90% and 70%, respectively. One and 3 months after ATG therapy, normal lymphocyte count was restored and the diversity of obtained CDR3 sequences increased; furthermore, the immunodominant clonotype was not detectable by sequencing. Similar trend was seen in other patients. Patient no. 46 did not harbor any immunodominant expansions and is not shown in the figure.

References

    1. Molldrem JJ, Caples M, Mavroudis D, Plante M, Young NS, Barrett AJ. Antithymocyte globulin for patients with myelodysplastic syndrome. Br J Haematol. 1997;99: 699-705. - PubMed
    1. Barrett J, Saunthararajah Y, Molldrem J. Myelodysplastic syndrome and aplastic anemia: distinct entities or diseases linked by a common pathophysiology? Semin Hematol. 2000;37: 15-29. - PubMed
    1. Molldrem JJ, Jiang YZ, Stetler-Stevenson M, Mavroudis D, Hensel N, Barrett AJ. Haematological response of patients with myelodysplastic syndrome to antithymocyte globulin is associated with a loss of lymphocyte-mediated inhibition of CFU-GM and alterations in T-cell receptor Vbeta profiles. Br J Haematol. 1998;102: 1314-1322. - PubMed
    1. Epperson DE, Nakamura R, Saunthararajah Y, Melenhorst J, Barrett AJ. Oligoclonal T cell expansion in myelodysplastic syndrome: evidence for an autoimmune process. Leuk Res. 2001;25: 1075-1083. - PubMed
    1. Lamy T, Loughran TP Jr. Current concepts: large granular lymphocyte leukemia. Blood Rev. 1999; 13: 230-240. - PubMed

Publication types

MeSH terms

Substances