Interpretive breakpoints for fluconazole and Candida revisited: a blueprint for the future of antifungal susceptibility testing
- PMID: 16614256
- PMCID: PMC1471993
- DOI: 10.1128/CMR.19.2.435-447.2006
Interpretive breakpoints for fluconazole and Candida revisited: a blueprint for the future of antifungal susceptibility testing
Abstract
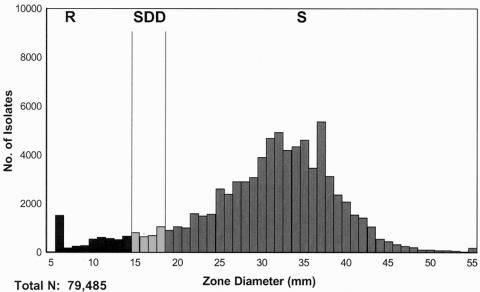
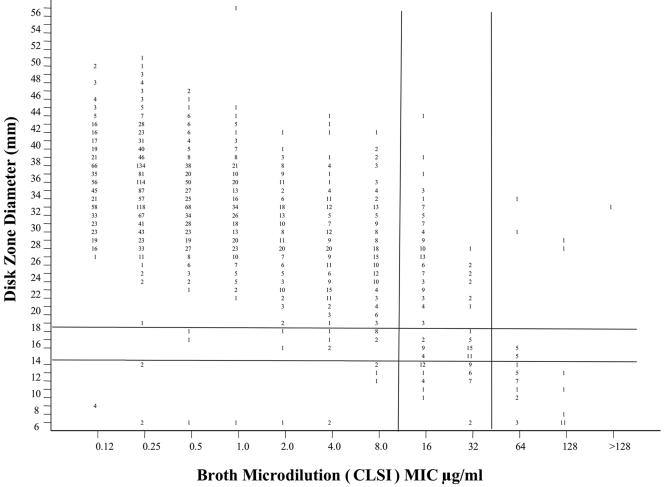
Developing interpretive breakpoints for any given organism-drug combination requires integration of the MIC distribution, pharmacokinetic and pharmacodynamic parameters, and the relationship between in vitro activity and outcome from both in vivo and clinical studies. Previously, the Subcommittee for Antifungal Testing of the Clinical and Laboratory Standards Institute (CLSI [formerly National Committee for Clinical Laboratory Standards]) proposed MIC interpretive breakpoints for fluconazole and Candida spp. These breakpoints were considered to be somewhat weak, because the clinical data supporting them came largely from mucosal infections and there were very few infections involving strains with elevated fluconazole MICs. We readdress the issue of fluconazole breakpoints for Candida by using published clinical and microbiologic data to provide further validation of the breakpoints proposed by the CLSI in 1997. We also address interpretive breakpoints for agar disk diffusion testing of fluconazole. The MIC distribution for fluconazole was determined with a collection of 13,338 clinical isolates. The overall MIC at which 90% of the isolates were inhibited was 8 microg/ml: 91% were susceptible (S) at a MIC of <or=8 microg/ml and 3% were resistant (R) (MIC >or= 64 microg/ml). Similar results were obtained for 2,190 isolates from randomized clinical trials. Analysis of available data for 1,295 patient-episode-isolate events (692 represented mucosal infections and 603 represented invasive infections) from 12 published clinical studies demonstrated an overall success rate of 77%, including 85% for those episodes in which the fluconazole MIC was <or=8 microg/ml, 67% for those episodes in which the MIC was 16 to 32 microg/ml, and 42% for those episodes with resistant (MIC >or= 64 microg/ml) isolates. Pharmacodynamic analysis demonstrated a strong relationship between MIC, fluconazole dose, and outcome. A dose/MIC ratio of approximately 25 was supportive of the following susceptibility breakpoints for fluconazole and Candida spp.: S, MIC <or= 8 microg/ml; susceptible-dose dependent (SDD), MIC = 16 to 32 microg/ml; R, MIC >or= 64 microg/ml. The corresponding disk test breakpoints are as follows: S, >or=19 mm; SDD, 15 to 18 mm; R, <or=14 mm.
Figures
References
-
- Anaissie, E. J., D. P. Kontoyiannis, C. Huls, S. E. Vartivarian, C. Karl, R. A. Prince, J. Bosso, and G. P. Bodey. 1995. Safety, plasma concentrations, and efficacy of high-dose fluconazole in invasive mold infections. J. Infect. Dis. 172:599-602. - PubMed
-
- Andes, D. 2003. Clinical pharmacodynamics of antifungals. Infect. Dis. Clin. N. Am. 17:635-649. - PubMed
-
- Antoniadou, A., H. A. Torres, R. E. Lewis, J. Thornby, G. P. Bodey, J. P. Tarrand, X. Y. Han, K. V. Rolston, A. Safdar, I. I. Raad, and D. P. Kontoyiannis. 2003. Candidemia in a tertiary care center: in vitro susceptibility and its association with outcome of initial antifungal therapy. Medicine 82:309-321. - PubMed
Publication types
MeSH terms
Substances
LinkOut - more resources
Full Text Sources
Other Literature Sources
Medical
Miscellaneous