Comparative Study
. 2006 Apr 13;34(7):1959-73.
doi: 10.1093/nar/gkl074. Print 2006.

Comparison of characteristics and function of translation termination signals between and within prokaryotic and eukaryotic organisms

Affiliations
Comparative Study

Comparison of characteristics and function of translation termination signals between and within prokaryotic and eukaryotic organisms

Andrew G Cridge et al. Nucleic Acids Res. .

Abstract

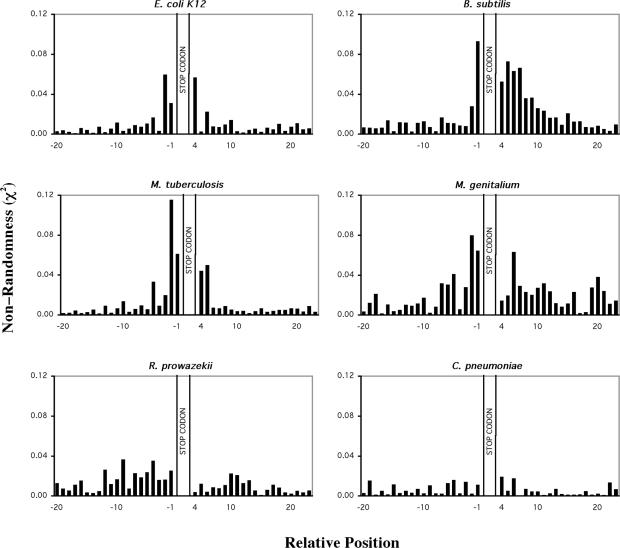
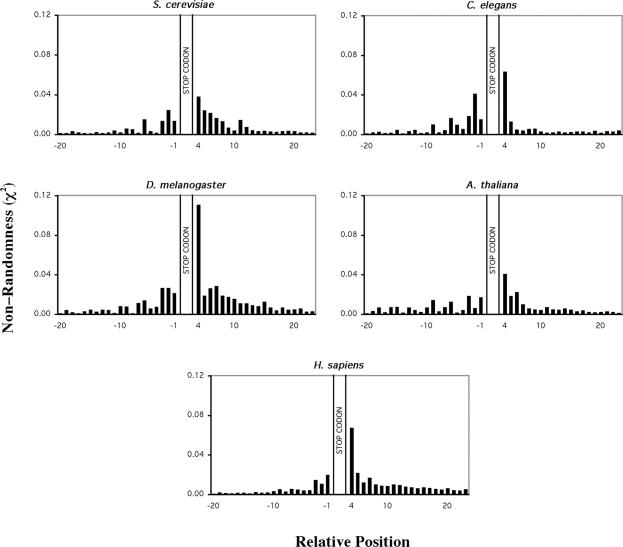
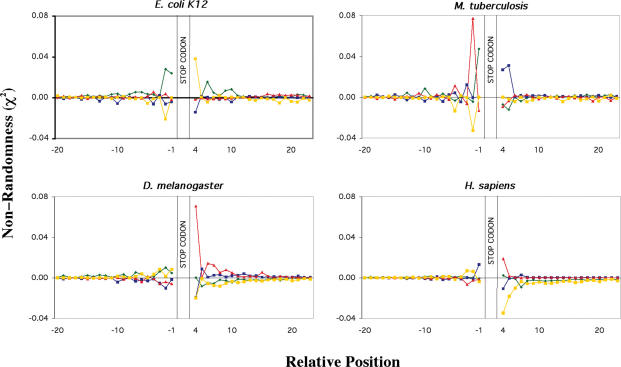
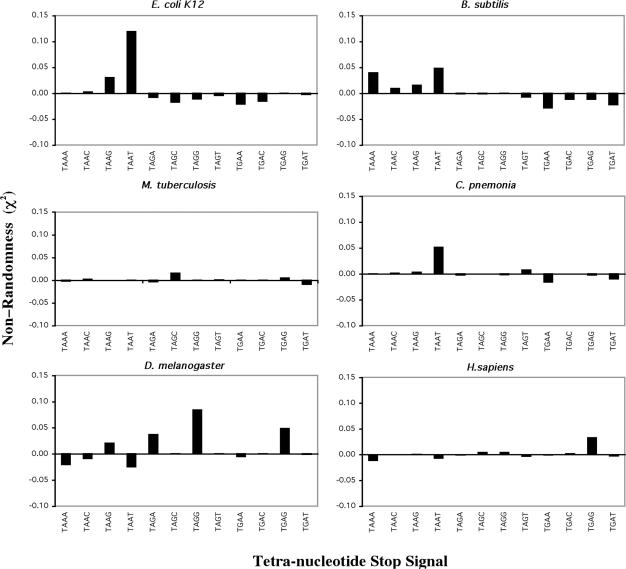
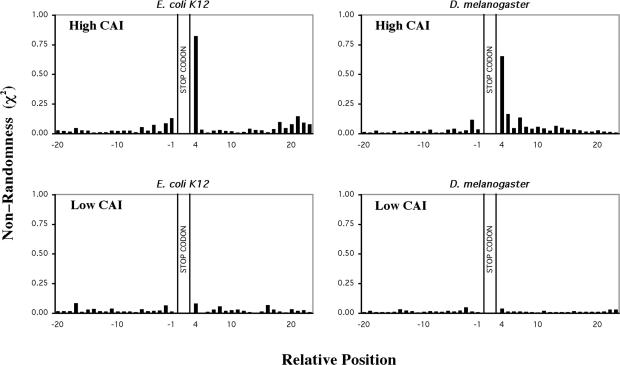
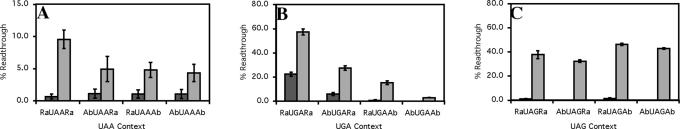
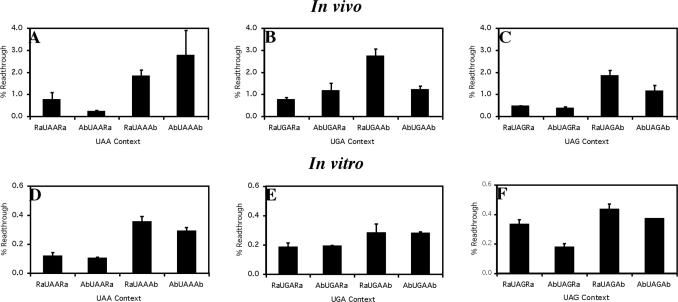
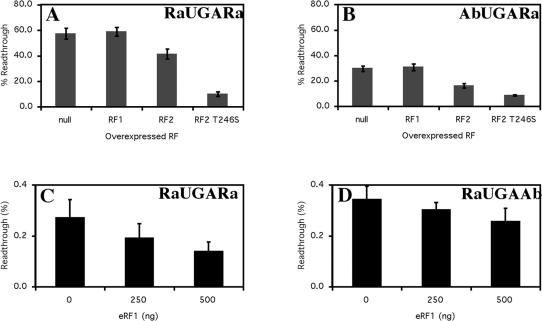
Six diverse prokaryotic and five eukaryotic genomes were compared to deduce whether the protein synthesis termination signal has common determinants within and across both kingdoms. Four of the six prokaryotic and all of the eukaryotic genomes investigated demonstrated a similar pattern of nucleotide bias both 5' and 3' of the stop codon. A preferred core signal of 4 nt was evident, encompassing the stop codon and the following nucleotide. Codons decoded by hyper-modified tRNAs were over-represented in the region 5' to the stop codon in genes from both kingdoms. The origin of the 3' bias was more variable particularly among the prokaryotic organisms. In both kingdoms, genes with the highest expression index exhibited a strong bias but genes with the lowest expression showed none. Absence of bias in parasitic prokaryotes may reflect an absence of pressure to evolve more efficient translation. Experiments were undertaken to determine if a correlation existed between bias in signal abundance and termination efficiency. In Escherichia coli signal abundance correlated with termination efficiency for UAA and UGA stop codons, but not in mammalian cells. Termination signals that were highly inefficient could be made more efficient by increasing the concentration of the cognate decoding release factor.


Figures

Figure 1
Figure 1
Bias in nucleotides around the translation termination codons of six selected prokaryotic genomes. Non-randomness, χ2 values were calculated for 20 nt 5′ and 3′ of the stop codon. The stop codon is located at nucleotide positions +1 to +3. χ2 values were calculated for all genes E.coli K12 (4199 genes), B.subtilis (4095 genes), M.tuberculosis (4148 genes), M.genitalium (481 genes), R.prowazekii (834 genes), C.pneumoniae (1108 genes). Predicted nucleotide frequencies used in the calculation were derived from 99 nt 5′ and 3′ to the stop codon. Coding region nucleotide frequencies were corrected for triplet periodicity by determining the nucleotide frequency at each of the three positions within the triplet codon (1, 2 or 3).
Figure 2
Figure 2
Bias in nucleotides around the translation termination codons of five selected eukaryotic genomes. Non-randomness, χ2 values were calculated for 20 nt 5′ and 3′ of the stop codon. The stop codon is located at nucleotide positions +1 to +3. χ2-Values were calculated for all genes S.cerevisiae (6258 genes), C.elegans (15 329 genes), D.melanogaster (14 027 genes), A.thaliana (14 172 genes) and H.sapiens (16 778 genes). Predicted nucleotide frequencies used in the calculation were derived from 99 nt 5′ and 3′ to the stop codon. Coding region nucleotide frequencies were corrected for triplet periodicity by determining the nucleotide frequency at each of the three positions within the triplet codon (1, 2 or 3).
Figure 3
Figure 3
Bias in individual nucleotides around the translational termination codons of two representative prokaryotic and eukaryotic genomes. Non-randomness of individual nucleotides, χ2 values were calculated for 20 bases 5′ and 3′ of the stop codon. The stop codon is located at nucleotide positions +1 to +3. χ2-Values were calculated for all genes E.coli K12 (4199 genes), M.tuberculosis (4148 genes), D.melanogaster (14 027 genes) and H.sapiens (16 778 genes). Individual nucleotides are represented by a green diamond A, dark blue square C, red triangle G and yellow square T. Predicted nucleotide frequencies used in the calculation were derived from 99 nt 5′ and 3′ to the stop codon. Coding region nucleotide frequencies were corrected for triplet periodicity by determining the nucleotide frequency at each of the three positions within the triplet codon (1, 2 or 3)
Figure 4
Figure 4
Bias in tetra-nucleotide translational stop signal in selected prokaryotic and eukaryotic genomes. Non-randomness of tetra-nucleotide sequences, χ2 values were calculated for the +1 to +4 nt for all genes E.coli K12 (4199 genes), B.subtilis (4095 genes), M.genitalium (481 genes), R.prowazekii (834 genes), D.melanogaster (14 027 genes) and H.sapiens (16 778 genes). Predicted codon frequencies used in the calculation were derived from 99 nt 3′ to the stop codon.
Figure 5
Figure 5
Bias in nucleotides around the translational termination codons of high and low CAI genes from E.coli K12 and D.melanogaster. Non-randomness, χ2-values were calculated for 20 nt 5′ and 3′ of the stop codon. The stop codon is located at nucleotide to ‘positions +1 to +3’. χ2-Values were calculated for the highest 5% (upper panels) and lowest 5% (lower panels) of genes ranked according to their CAI value E.coli (214 genes) D.melonogaster (701 genes). Predicted nucleotide frequencies used in the calculation were derived from 99 nt 5′ and 3′ to the stop codon. Coding region nucleotide frequencies were corrected for triplet periodicity by determining the nucleotide frequency at each of the three positions within the triplet codon (1, 2 or 3).
Figure 6
Figure 6
Termination efficiency of the (A) UAA, (B) UGA and (C) UAG ‘abundant’ and ‘rare’ termination signals in E.coli. Termination efficiency was derived from the 3A′ protein synthesis termination assay (26). Readthrough (%) was calculated by comparison of readthrough protein (3A′) to total protein (3A′ + 2A′). Constructs were assayed in specific strains of E.coli XAc wild-type strain (dark grey), XA105 UAA suppressor strain (light grey), CDJ64 UGA suppressor strain (light grey) and XA101 UAG suppressor strain (light grey). The mean values from six experiments are presented. Error bars are ±SEM.
Figure 7
Figure 7
Termination efficiency of the eukaryotic UAA, UGA and UAG ‘abundant’ and ‘rare’ termination signals in vitro and in vivo. Termination efficiency was derived from a dual luciferase protein synthesis termination assay in vitro (AC) and in vivo using COS-7 cells (DF). Readthrough (%) was calculated by comparison to a control construct (UGG). The mean values from three experiments are presented. Error bars are ±SEM.
Figure 8
Figure 8
Effect of increasing E.coli RF1, RF2 and RF2-T246S and human eRF1 expression on termination efficiency. Termination efficiency of the prokaryotic 5′Ra UGA Ra3′ (A) and 5′Ab UGA Ra3′ (B) sequence contexts were measured with the 3A′ protein synthesis termination assay (26). Constructs were assayed in the specific E.coli UGA suppressor strain CDJ64. The mean values from three experiments are presented. Error bars are ±SEM. Termination efficiency of the eukaryotic 5′Ra UGA Ra3′ (C) and 5′Ra UGA Ab3′ (D) sequence contexts were measured with the dual luciferase protein synthesis termination assay in vitro. The assay was supplemented with 250 ng and 500 ng of eRF1 where indicated. Readthrough (%) was calculated by comparison to a control construct (UGG). Experiments were performed in triplicate with a single construct of each signal context. Mean values from three experiments are presented. Error bars are ±SEM.

Similar articles

Cited by

References

    1. Poole E., Tate W. Release factors and their role as decoding proteins: specificity and fidelity for termination of protein synthesis. Biochim. Biophys. Acta. 2000;1493:1–11. - PubMed
    1. Nakamura Y., Ito K. Making sense of mimic in translation termination. Trends Biochem. Sci. 2003;28:99–105. - PubMed
    1. Kisselev L., Ehrenberg M., Frolova L. Termination of translation: interplay of mRNA, rRNAs and release factors? EMBO J. 2003;22:175–182. - PMC - PubMed
    1. Buckingham R.H., Grentzmann G., Kisselev L. Polypeptide chain release factors. Mol. Microbiol. 1997;24:449–456. - PubMed
    1. Inge-Vechtomov S., Zhouravleva G., Philippe M. Eukaryotic release factors (eRFs) history. Biol. Cell. 2003;95:195–109. - PubMed

Publication types