Synaptic organization of projections from the amygdala to visual cortical areas TE and V1 in the macaque monkey
- PMID: 16615120
- PMCID: PMC2564872
- DOI: 10.1002/cne.20945
Synaptic organization of projections from the amygdala to visual cortical areas TE and V1 in the macaque monkey
Abstract
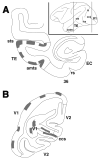
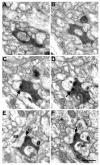
The primate amygdaloid complex projects to a number of visual cortices, including area V1, primary visual cortex, and area TE, a higher-order unimodal visual area involved in object recognition. We investigated the synaptic organization of these projections by injecting anterograde tracers into the amygdaloid complex of Macaca fascicularis monkeys and examining labeled boutons in areas TE and V1 using the electron microscope. The 256 boutons examined in area TE formed 263 synapses. Two hundred twenty-three (84%) of these were asymmetric synapses onto dendritic spines and 40 (15%) were asymmetric synapses onto dendritic shafts. Nine boutons (3.5%) formed double asymmetric synapses, generally on dendritic spines, and 2 (1%) of the boutons did not form a synapse. The 200 boutons examined in area V1 formed 211 synapses. One hundred eighty-nine (90%) were asymmetric synapses onto dendritic spines and 22 (10%) were asymmetric synapses onto dendritic shafts. Eleven boutons (5.5%) formed double synapses, usually with dendritic spines. We conclude from these observations that the amygdaloid complex provides an excitatory input to areas TE and V1 that primarily influences spiny, probably pyramidal, neurons in these cortices.
Copyright 2006 Wiley-Liss, Inc.
Figures


Similar articles
-
The organization of projections from the amygdala to visual cortical areas TE and V1 in the macaque monkey.J Comp Neurol. 2005 Jun 13;486(4):295-317. doi: 10.1002/cne.20520. J Comp Neurol. 2005. PMID: 15846786
-
The synaptic connections between cortical areas V1 and V2 in macaque monkey.J Neurosci. 2009 Sep 9;29(36):11283-93. doi: 10.1523/JNEUROSCI.5757-08.2009. J Neurosci. 2009. PMID: 19741135 Free PMC article.
-
The connection from cortical area V1 to V5: a light and electron microscopic study.J Neurosci. 1998 Dec 15;18(24):10525-40. doi: 10.1523/JNEUROSCI.18-24-10525.1998. J Neurosci. 1998. PMID: 9852590 Free PMC article.
-
Synaptic targets of pyramidal neurons providing intrinsic horizontal connections in monkey prefrontal cortex.J Comp Neurol. 1998 Jan 12;390(2):211-24. doi: 10.1002/(sici)1096-9861(19980112)390:2<211::aid-cne4>3.0.co;2-4. J Comp Neurol. 1998. PMID: 9453665
-
Polyneuronal innervation of spiny stellate neurons in cat visual cortex.J Comp Neurol. 1994 Mar 1;341(1):39-49. doi: 10.1002/cne.903410105. J Comp Neurol. 1994. PMID: 8006222
Cited by
-
Adults vs. neonates: Differentiation of functional connectivity between the basolateral amygdala and occipitotemporal cortex.PLoS One. 2020 Oct 19;15(10):e0237204. doi: 10.1371/journal.pone.0237204. eCollection 2020. PLoS One. 2020. PMID: 33075046 Free PMC article.
-
Anxiety modulates the effects of emotion and attention on early vision.Cogn Emot. 2013;27(1):166-76. doi: 10.1080/02699931.2012.689953. Epub 2012 Jul 12. Cogn Emot. 2013. PMID: 22784014 Free PMC article.
-
Internal valence modulates the speed of object recognition.Sci Rep. 2017 Mar 23;7(1):361. doi: 10.1038/s41598-017-00385-4. Sci Rep. 2017. PMID: 28336933 Free PMC article.
-
Integrative Processing of Touch and Affect in Social Perception: An fMRI Study.Front Hum Neurosci. 2016 May 10;10:209. doi: 10.3389/fnhum.2016.00209. eCollection 2016. Front Hum Neurosci. 2016. PMID: 27242474 Free PMC article.
-
Conserved features of anterior cingulate networks support observational learning across species.Neurosci Biobehav Rev. 2019 Dec;107:215-228. doi: 10.1016/j.neubiorev.2019.09.009. Epub 2019 Sep 8. Neurosci Biobehav Rev. 2019. PMID: 31509768 Free PMC article. Review.
References
-
- Adolphs R, Tranel D, Damasio H, Damasio A. Impaired recognition of emotion in facial expressions following bilateral damage to the human amygdala. Nature. 1994;372(6507):669–672. - PubMed
-
- Aggleton JP. The amygdala : a functional analysis. xiv. Oxford ; New York: Oxford University Press; 2000. p. 690.
-
- Aggleton JP, Burton MJ, Passingham RE. Cortical and subcortical afferents to the amygdala of the rhesus monkey (Macaca mulatta) Brain Res. 1980;190(2):347–368. - PubMed
-
- Amaral DG, Behniea H, Kelly JL. Topographic organization of projections from the amygdala to the visual cortex in the macaque monkey. Neuroscience. 2003;118(4):1099–1120. - PubMed
Publication types
MeSH terms
Grants and funding
LinkOut - more resources
Full Text Sources

