. 2006 Feb 22;273(1585):503-11.
doi: 10.1098/rspb.2005.3354.

The brainstem reticular formation is a small-world, not scale-free, network

Affiliations

The brainstem reticular formation is a small-world, not scale-free, network

M D Humphries et al. Proc Biol Sci. .

Abstract

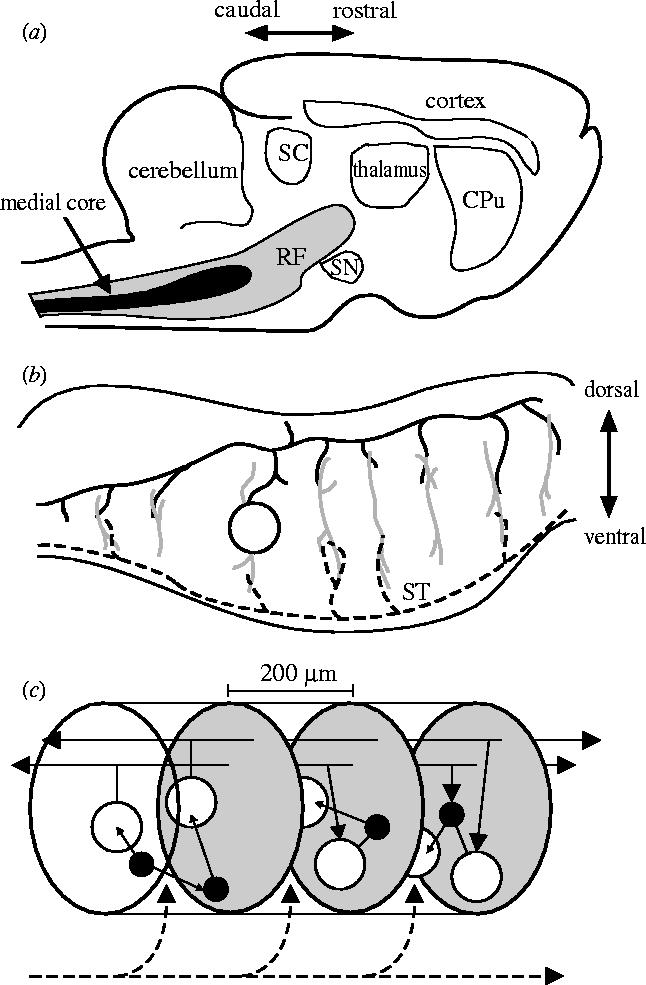
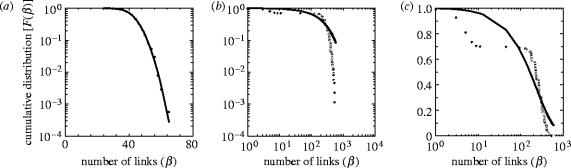
Recently, it has been demonstrated that several complex systems may have simple graph-theoretic characterizations as so-called 'small-world' and 'scale-free' networks. These networks have also been applied to the gross neural connectivity between primate cortical areas and the nervous system of Caenorhabditis elegans. Here, we extend this work to a specific neural circuit of the vertebrate brain--the medial reticular formation (RF) of the brainstem--and, in doing so, we have made three key contributions. First, this work constitutes the first model (and quantitative review) of this important brain structure for over three decades. Second, we have developed the first graph-theoretic analysis of vertebrate brain connectivity at the neural network level. Third, we propose simple metrics to quantitatively assess the extent to which the networks studied are small-world or scale-free. We conclude that the medial RF is configured to create small-world (implying coherent rapid-processing capabilities), but not scale-free, type networks under assumptions which are amenable to quantitative measurement.


Figures

Figure 1
Figure 1
Schematic summary of the vertebrate reticular formation's anatomical organization. Directional arrows apply to all panels. (a) Sagittal section of cat brain, showing relative size and location of reticular formation (RF) and medial core. Abbreviations: CPu, caudate-putamen; SC, superior colliculus; SN, substantia nigra. (b) Sagittal section of the brainstem; the dendritic trees (grey lines) of the projection neurons (one cell body shown, open circle) extend throughout the medial RF along the dorso-ventral axis but extend little along the rostro-caudal axis. These dendritic trees contact axon collaterals of both ascending sensory systems (black dashed line) and far-reaching axons of the projection neurons (the axon of the depicted cell body is shown by the solid black line); ST is the spinothalamic tract. (c) The cluster model of RF organization. The medial RF comprises stacked clusters (three shown) containing medium-to-large projection neurons (open circles) and small-to-medium inter-neurons (filled circles); cluster limits (grey ovals) are defined by the initial collaterals from the projection neuron axons. Their radial dendritic fields allow sampling of ascending and descending input from both other clusters (solid black lines) and sensory systems (dashed black line). The interneurons project predominantly within their parent cluster.
Figure 2
Figure 2
Variations in small-world topology for the stochastic anatomical model. (a) Distance-dependent collaterals. (b) Spatially uniform collaterals. A value of zero indicates that the model did not meet the minimum criteria for the topology.
Figure 3
Figure 3
Variations in small-world topology for the pruning anatomical model. (a) Distance-dependent collaterals. (b) Spatially uniform collaterals. Every model met the criteria for the topology.
Figure 4
Figure 4
Robustness of the small-world topology. (a) Coefficient of variation of S for each model set tested. (b) Mean clustering coefficients for model-types and equivalent random networks. Small and large refer to the minimum and maximum quantities of cells, respectively. Asterisks indicate significance at the p<0.001 level; (M)=Mann–Whitney U-test; (T)=Student's t-test; Error bars are ±3 s.e.
Figure 5
Figure 5
Best-fit curves to example cumulative degree distributions F(β), all from the stochastic model. (a) Linear-log plot showing an example of Gaussian fit to input distribution from the distance-dependent collateral variant—the dominant best-fit of the tested model curves. (b) Log–log plot showing an example of an exponential best-fit to an output distribution from the distance-dependent model: tail of the data was not fitted by any tested curve. The absence of the characteristic power-law tail is clear. (c) The same data and fit shown as a log-linear plot make clear that the exponential fit was the least-worst of those tested, rather than an accurate fit.

Similar articles

Cited by

References

    1. Albert R, Barabasi A.-L. Statistical mechanics of complex networks. Rev. Mod. Phys. 2002;74:47–97. doi:10.1103/RevModPhys.74.47 - DOI
    1. Amaral L.A, Scala A, Barthelemy M, Stanley H.E. Classes of small-world networks. Proc. Natl Acad. Sci. USA. 2000;97:11 149–11 152. doi:10.1073/pnas.200327197 - DOI - PMC - PubMed
    1. Ascoli G. Progress and perspectives in computational neuroanatomy. Anat. Rec. 1999;257:195–207. doi:10.1002/(SICI)1097-0185(19991215)257:6<195::AID-AR5>3.0.CO;2-H - DOI - PubMed
    1. Barabasi A.-L, Albert R. Emergence of scaling in random networks. Science. 1999;286:509–512. doi:10.1126/science.286.5439.509 - DOI - PubMed
    1. Bourgeois J.P, Rakic P. Changes of synaptic density in the primary visual cortex of the macaque monkey from fetal to adult stage. J. Neurosci. 1993;13:2801–2820. - PMC - PubMed

Publication types

LinkOut - more resources