

Quantitative studies of allosteric effects by biointeraction chromatography: analysis of protein binding for low-solubility drugs
- PMID: 16615779
- PMCID: PMC2556871
- DOI: 10.1021/ac052017b
Quantitative studies of allosteric effects by biointeraction chromatography: analysis of protein binding for low-solubility drugs
Abstract
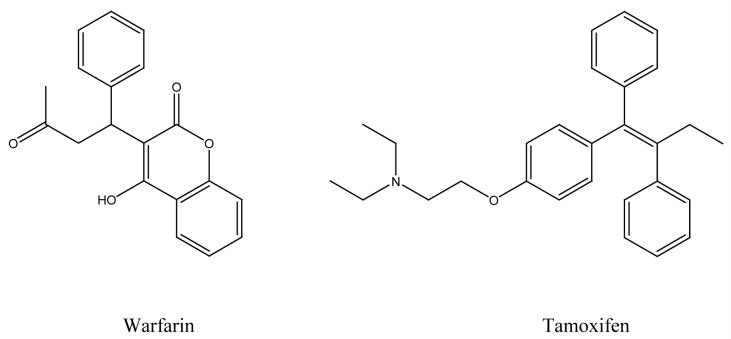
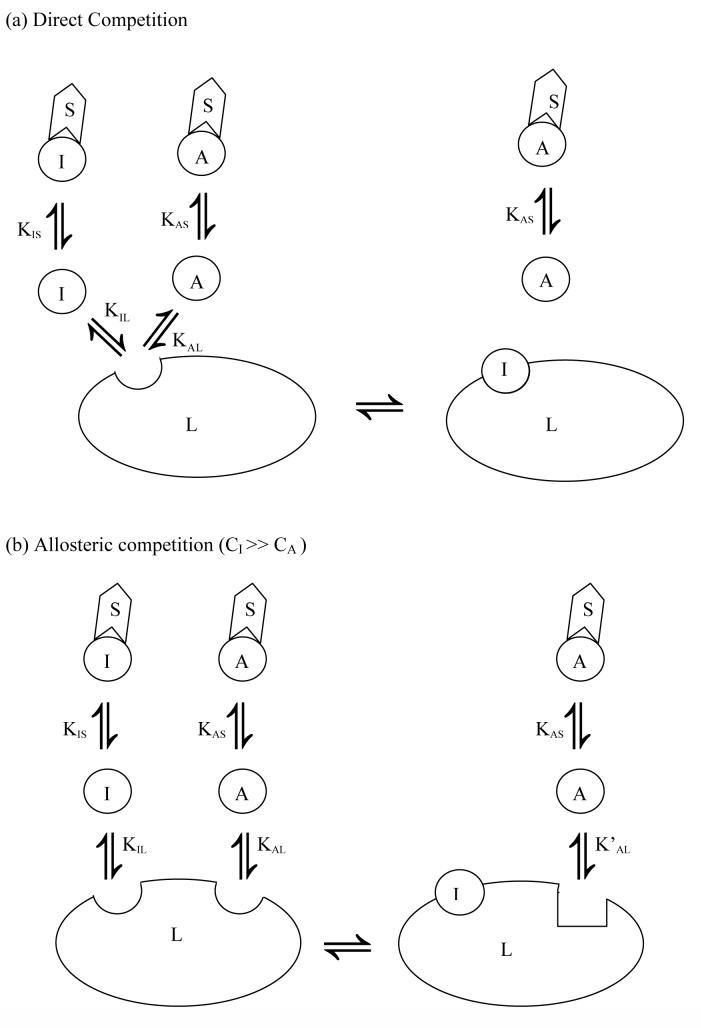
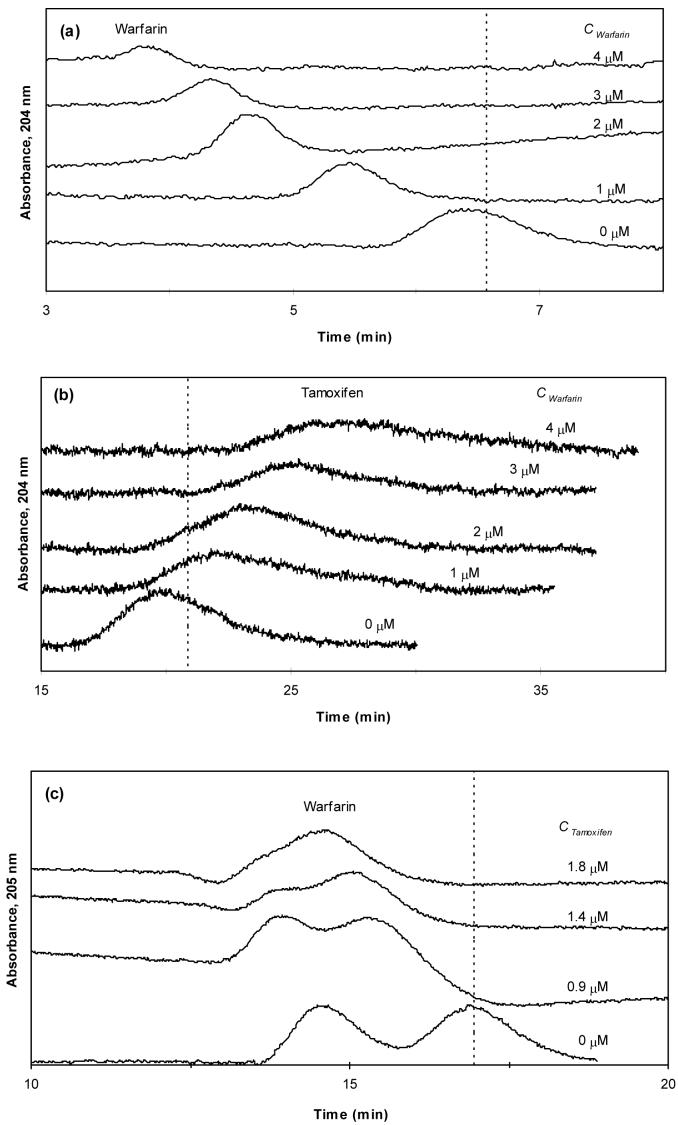
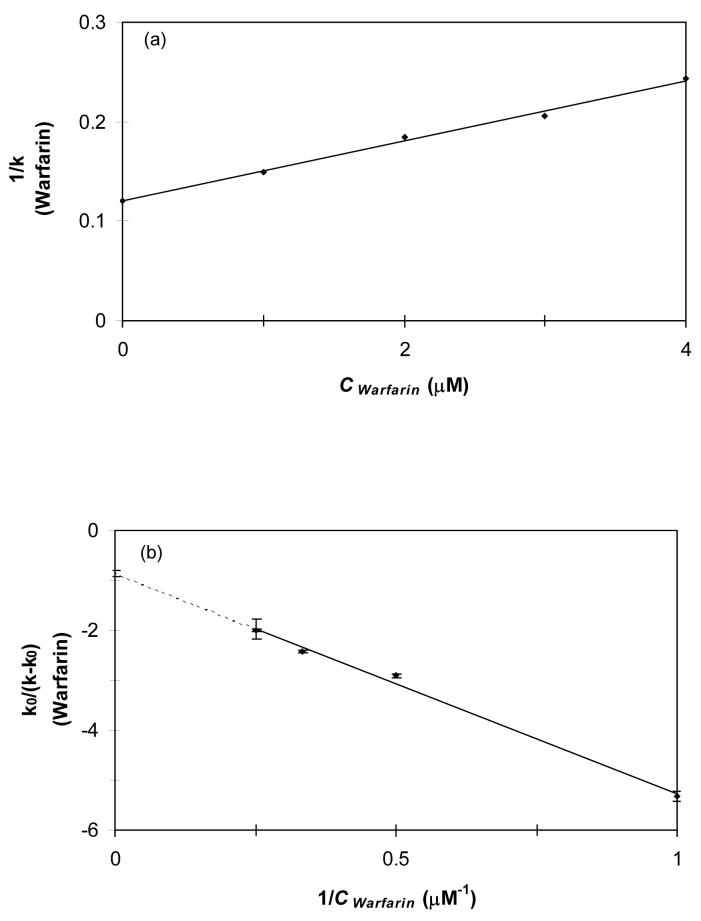
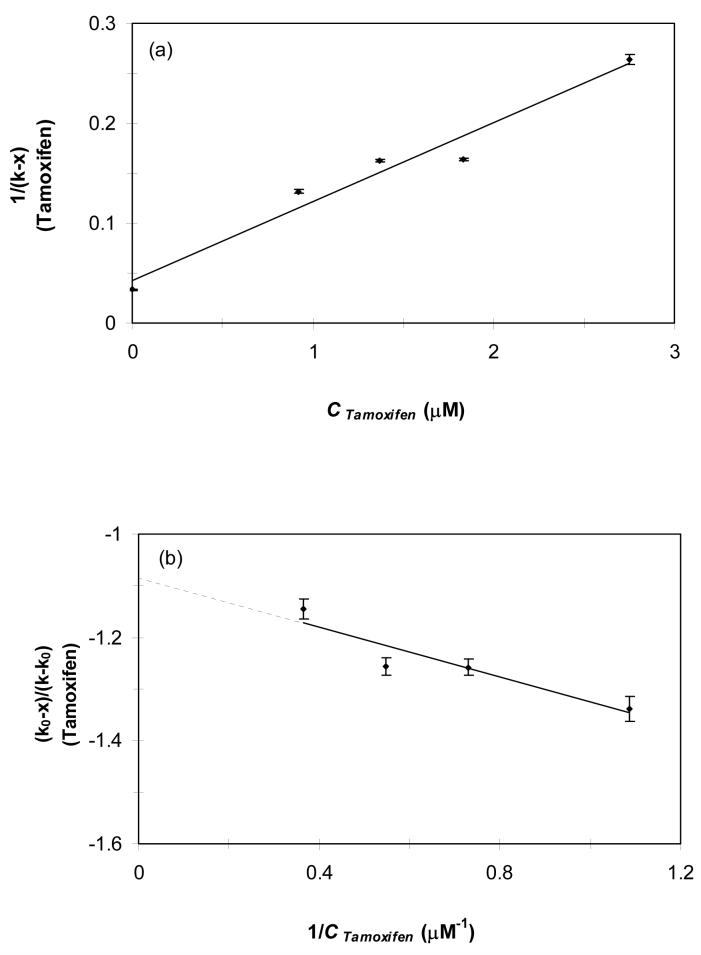
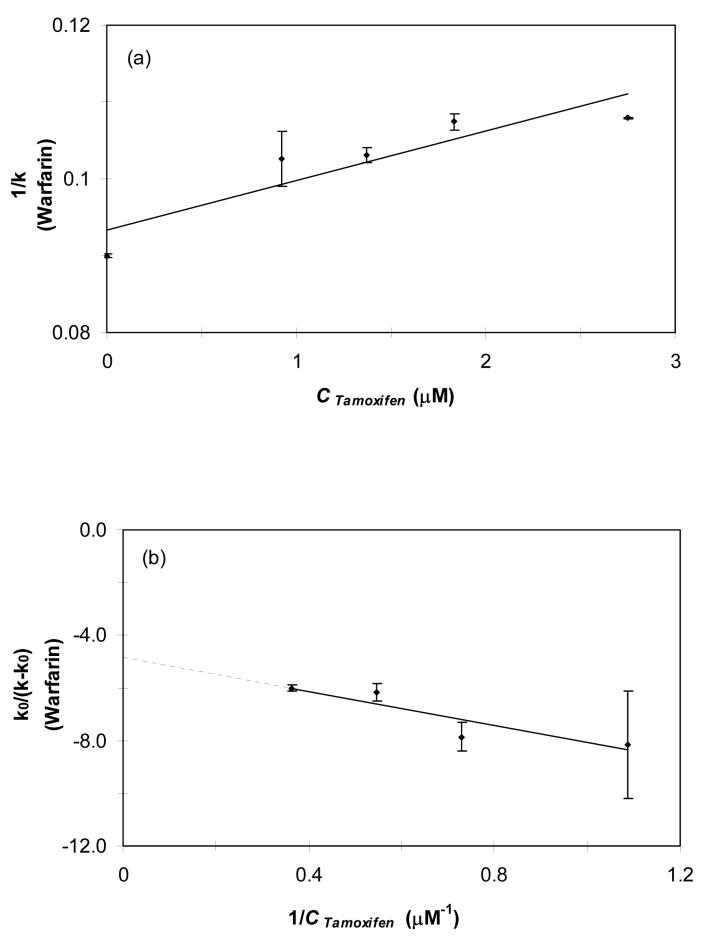
A new chromatographic method was developed for characterizing allosteric interactions between an immobilized binding agent and low-solubility compounds. This approach was illustrated by using it to characterize the interactions between tamoxifen and warfarin during their binding to the protein human serum albumin (HSA), with beta-cyclodextrin being employed as a solubilizing agent for these drugs. It was confirmed in this work through several experiments that warfarin had a single binding site on HSA with an association equilibrium constant of (2-5) x 10(5) M(-1) (average, 3.9 x 10(5) M(-1)) at 37 degrees C, in agreement with previous reports. It was also found that tamoxifen had a single major binding site on HSA, with an association equilibrium constant of (3-4) x 10(7) M(-1) (average, 3.5 x 10(7) M(-1)) at 37 degrees C. When warfarin was used as a mobile-phase additive in competition studies with tamoxifen, this had a positive allosteric effect on tamoxifen/HSA binding, giving a coupling constant of 2.3 (+/-0.3). Competitive studies using tamoxifen as a mobile-phase additive indicated that tamoxifen had a negative allosteric effect on warfarin/HSA binding, providing a coupling constant of 0.79 (+/-0.03). A unique feature of the technique described in this report was its ability to independently examine both directions of the warfarin/tamoxifen allosteric interaction. This approach is not limited to warfarin, tamoxifen, and HSA but can also be used to study other solutes and binding agents.
Figures


Similar articles
-
Chromatographic analysis of carbamazepine binding to human serum albumin.J Chromatogr B Analyt Technol Biomed Life Sci. 2005 Feb 25;816(1-2):57-66. doi: 10.1016/j.jchromb.2004.11.006. J Chromatogr B Analyt Technol Biomed Life Sci. 2005. PMID: 15664334
-
Analysis of multi-site drug-protein interactions by high-performance affinity chromatography: Binding by glimepiride to normal or glycated human serum albumin.J Chromatogr A. 2015 Aug 21;1408:133-44. doi: 10.1016/j.chroma.2015.07.012. Epub 2015 Jul 6. J Chromatogr A. 2015. PMID: 26189669 Free PMC article.
-
Studies by biointeraction chromatography of binding by phenytoin metabolites to human serum albumin.J Chromatogr B Analyt Technol Biomed Life Sci. 2006 May 19;836(1-2):83-91. doi: 10.1016/j.jchromb.2006.03.043. Epub 2006 Apr 18. J Chromatogr B Analyt Technol Biomed Life Sci. 2006. PMID: 16621742
-
Allostery in a monomeric protein: the case of human serum albumin.Biophys Chem. 2010 May;148(1-3):16-22. doi: 10.1016/j.bpc.2010.03.001. Epub 2010 Mar 6. Biophys Chem. 2010. PMID: 20346571 Review.
-
Understanding the physical and chemical nature of the warfarin drug binding site in human serum albumin: experimental and theoretical studies.Curr Pharm Des. 2015;21(14):1800-16. doi: 10.2174/1381612821666150304163447. Curr Pharm Des. 2015. PMID: 25738490 Review.
Cited by
-
Evaluation of affinity microcolumns containing human serum albumin for rapid analysis of drug-protein binding.J Chromatogr B Analyt Technol Biomed Life Sci. 2010 Jun 15;878(20):1707-13. doi: 10.1016/j.jchromb.2010.04.028. Epub 2010 Apr 24. J Chromatogr B Analyt Technol Biomed Life Sci. 2010. PMID: 20462808 Free PMC article.
-
Analysis of solute-protein interactions and solute-solute competition by zonal elution affinity chromatography.Methods. 2018 Aug 15;146:3-11. doi: 10.1016/j.ymeth.2018.01.020. Epub 2018 Feb 2. Methods. 2018. PMID: 29409783 Free PMC article. Review.
-
Pharmaceutical and biomedical applications of affinity chromatography: recent trends and developments.J Pharm Biomed Anal. 2012 Oct;69:93-105. doi: 10.1016/j.jpba.2012.01.004. Epub 2012 Jan 14. J Pharm Biomed Anal. 2012. PMID: 22305083 Free PMC article. Review.
-
Development of enhanced capacity affinity microcolumns by using a hybrid of protein cross-linking/modification and immobilization.J Chromatogr A. 2015 Jun 26;1400:82-90. doi: 10.1016/j.chroma.2015.04.051. Epub 2015 May 1. J Chromatogr A. 2015. PMID: 25981291 Free PMC article.
-
Characterization of solution-phase drug-protein interactions by ultrafast affinity extraction.Methods. 2018 Aug 15;146:46-57. doi: 10.1016/j.ymeth.2018.02.021. Epub 2018 Mar 3. Methods. 2018. PMID: 29510250 Free PMC article.
References
-
- Sjoholm I. Ch. 4. In: Reidenberg MM, Erill S, editors. Drug-Protein Binding. Praeger; New York: 1986.
-
- Christopoulos A, Kenakin T. Pharmacol. Rev. 2002;54:323. - PubMed
-
- Domenici E, Bertucci C, Salvadori P, Wainer IW. J. Pharm. Sci. 1991;80:164. - PubMed
-
- Fitos I, Visy J, Simonyi M, Hermansson J. Chirality. 1999;11:115. - PubMed
-
- Wainer IW. Nature Biotechnol. 2004;22:1376. - PubMed
Publication types
MeSH terms
Substances
Grants and funding
LinkOut - more resources
Full Text Sources
Other Literature Sources
Medical
