

Viral load, CD4+ T-lymphocyte counts and antibody titres in HIV-1 infected untreated children in Kenya; implication for immunodeficiency and AIDS progression
- PMID: 16615820
- PMCID: PMC1831957
- DOI: 10.5555/afhs.2006.6.1.3
Viral load, CD4+ T-lymphocyte counts and antibody titres in HIV-1 infected untreated children in Kenya; implication for immunodeficiency and AIDS progression
Abstract
Background: There are limited reports on HIV-1 RNA load, CD4+ T-lymphocytes and antibody responses in relation to disease progression in HIV-1 infected untreated children in Africa.
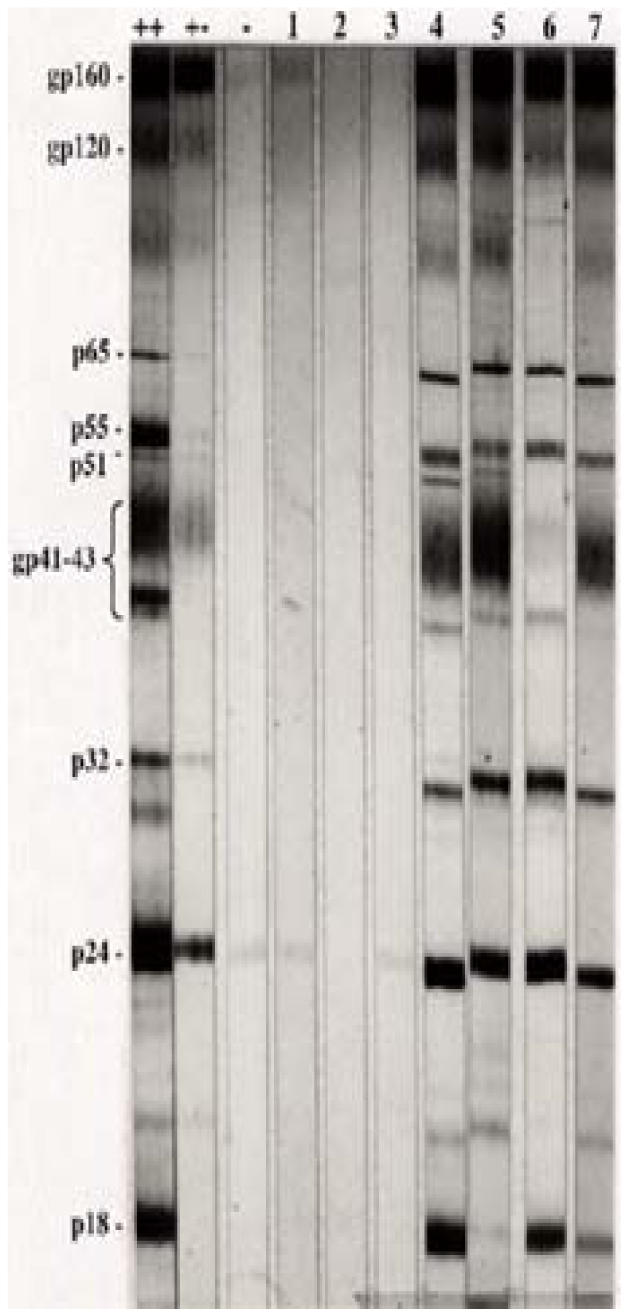
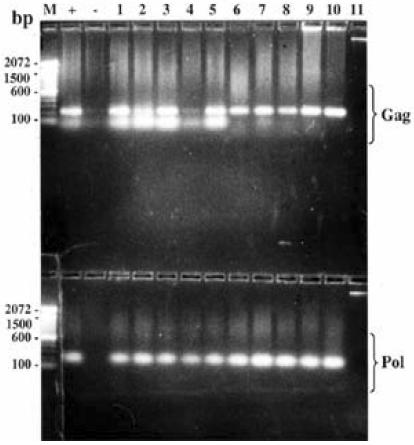
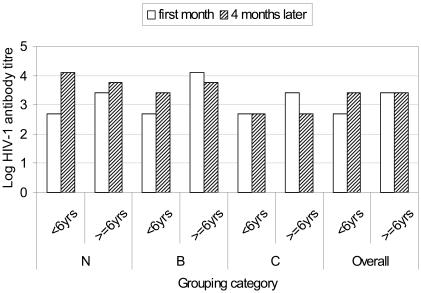
Methods: To describe the relationships between these parameters, we conducted a longitudinal cohort study involving 51 perinatally HIV-1 infected children aged between 1 and 13 years. HIV status was determined by ELISA and confirmed by western blot and PCR. Antibodies were quantified by limiting dilution ELISA, plasma HIV-1 RNA load by RT-PCR and CD4+ T-lymphocytes by FACSCount.
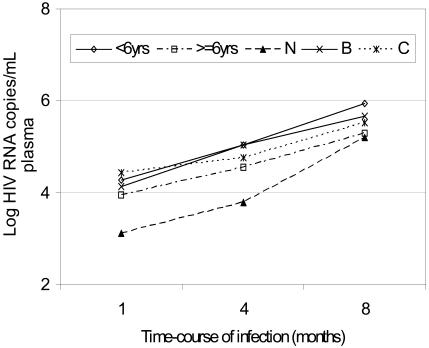
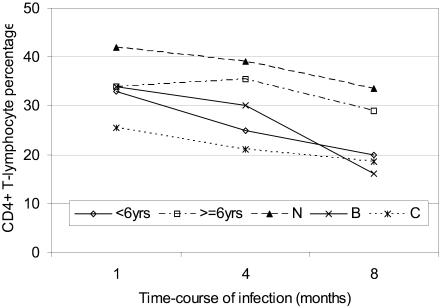
Results: Asymptomatic and symptomatic disease had, respectively, a rise in median HIV-1 RNA load from 1,195 to 132,543 and from 42,962 to 1,109,281 copies/ml in children below 6 years. The increase in viral load was 10-fold higher for asymptomatic compared to other categories and 2-fold faster for children less than 6 years than those above. Similarly, symptomatic children below 6 years had initial median CD4+ T-lymphocyte counts of 647 (22%) cells/muL, declining to 378 (20%) while those above 6 years had initial values of below 335 (15%) but which increased to 428 (17%). Median viral load correlated significantly with median CD4+ T-lymphocyte percentage in children above 6 years (p=0.026) but not below.
Conclusions: Viral load is lower in older than younger children and correlates significantly with percentage CD4+ T-lymphocytes. Survival by HIV-1 infected children requires a competent immune response early in infection to counter the rapidly replicating virus. Interventions aimed at boosting the naïve immune system may prolong survival in these children.
Figures
Similar articles
-
HIV-1 viral load and CD4 cell count in untreated children with vertically acquired asymptomatic or mild disease. Paediatric European Network for Treatment of AIDS (PENTA).AIDS. 1998 Mar 5;12(4):F1-8. AIDS. 1998. PMID: 9520161 Clinical Trial.
-
Long-term immunological response in HIV-1-infected subjects receiving potent antiretroviral therapy.AIDS. 2000 May 26;14(8):959-69. doi: 10.1097/00002030-200005260-00007. AIDS. 2000. PMID: 10853977
-
Initial plasma HIV-1 RNA levels and progression to AIDS in women and men.N Engl J Med. 2001 Mar 8;344(10):720-5. doi: 10.1056/NEJM200103083441003. N Engl J Med. 2001. PMID: 11236775
-
[Consensus document of Gesida and Spanish Secretariat for the National Plan on AIDS (SPNS) regarding combined antiretroviral treatment in adults infected by the human immunodeficiency virus (January 2012)].Enferm Infecc Microbiol Clin. 2012 Jun;30(6):e1-89. doi: 10.1016/j.eimc.2012.03.006. Epub 2012 May 23. Enferm Infecc Microbiol Clin. 2012. PMID: 22633764 Spanish.
-
Unravelling the mechanisms of durable control of HIV-1.Nat Rev Immunol. 2013 Jul;13(7):487-98. doi: 10.1038/nri3478. Nat Rev Immunol. 2013. PMID: 23797064 Review.
Cited by
-
HIV-1 Viral Loads Are Not Elevated in Individuals Co-infected With Schistosoma spp. After Adjustment for Duration of HIV-1 Infection.Front Immunol. 2018 Sep 6;9:2005. doi: 10.3389/fimmu.2018.02005. eCollection 2018. Front Immunol. 2018. PMID: 30237799 Free PMC article.
-
Co-Infection Burden of Hepatitis C Virus and Human Immunodeficiency Virus among Injecting Heroin Users at the Kenyan Coast.PLoS One. 2015 Jul 24;10(7):e0132287. doi: 10.1371/journal.pone.0132287. eCollection 2015. PLoS One. 2015. PMID: 26208212 Free PMC article.
References
-
- Goudsmit J, de Wolf F. Expression of human immunodeficiency virus antigen (HIV-Ag) in serum and cerebrospinal fluid during acute and chronic infection. Lancet. 1986;2:177–180. - PubMed
-
- Scott GB, Buck BE, Leterman JG, Bloom FL, Parks WP. Acquired immune deficiency syndrome in infants. N Engl J Med. 1984;310:76–81. - PubMed
-
- Falloon JJ, Eddy L, Weiner L, Pizzo PA. Human immunodeficiency virus infection in children. J Pediatr. 1989;114:1–30. - PubMed
-
- Buchbinder SP, Katz MH, Hessol NA, O'Malley PM, Holmberg SD. Long-term HIV-1 infection without immunologic progression. AIDS. 1994;8:1123–1128. - PubMed
-
- Haynes BF, Pantaleo G, Fauci AS. Toward an understanding of the correlates of protective immunity to HIV infection. Science. 1996;271:324–328. - PubMed
Publication types
MeSH terms
Substances
LinkOut - more resources
Full Text Sources
Medical
Research Materials