. 2006 Jun 16;281(24):16230-7.
doi: 10.1074/jbc.M600650200. Epub 2006 Apr 14.

Pseudomonas aeruginosa porin OprF: properties of the channel

Affiliations

Pseudomonas aeruginosa porin OprF: properties of the channel

Ekaterina M Nestorovich et al. J Biol Chem. .

Abstract

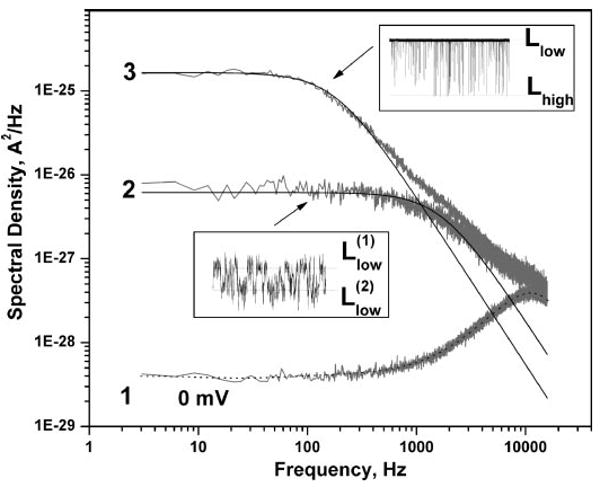
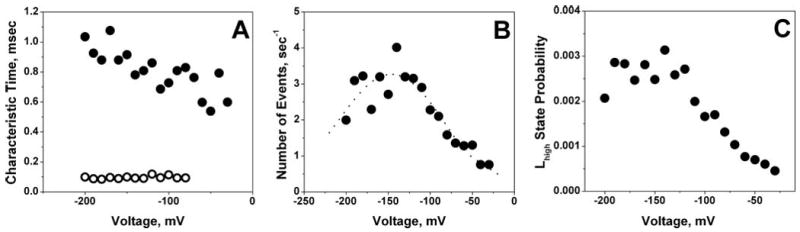
Using ion channel reconstitution in planar lipid bilayers, we examined the channel-forming activity of subfractions of Pseudomonas aeruginosa OprF, which was shown to exist in two different conformations: a minority single domain conformer and a majority two-domain conformer (Sugawara, E., Nestorovich, E. M., Bezrukov, S. M., and Nikaido, H. (2006) J. Biol. Chem. 281, 16220-16229). With the fraction depleted for the single domain conformer, we were unable to detect formation of any channels with well defined conductance levels. With the unfractionated OprF, we saw only rare channel formation. However, with the single domain-enriched fraction of OprF, we observed regular insertion of channels with highly reproducible conductances. Single OprF channels demonstrate rich kinetic behavior exhibiting spontaneous transitions between several subconformations that differ in ionic conductance and radius measured in polymer exclusion experiments. Although we showed that the effective radius of the most conductive conformation exceeds that of the general outer membrane porin of Escherichia coli, OmpF, we also found that a single OprF channel mainly exists in weakly conductive subconformations and switches to the fully open state for a short time only. Therefore, the low permeability of OprF reported earlier may be due to two factors: mainly to the paucity of the single domain conformer in the OprF population and secondly to the predominance of weakly conductive subconformations within the single domain conformer.


Figures

FIGURE 1
FIGURE 1. The OprF N-terminal domain lacks pore-forming activity in the proteoliposome swelling assay
Different amounts of either the N-terminal domain or the complete OprF protein were reconstituted into proteoliposomes in 15% Dextran T-40, and the osmotic swelling was observed in isotonic solutions of various small solutes. The figure shows the behavior of complete OprF in l-arabinose (◆) and N-terminal domain in l-arabinose (■), l-alanine (▲), glycine (●), and l-serine (◊). Each data point shown represents the average of five experiments. Although there were marginal decreases in optical density with vesicles containing the N-terminal domain, these were not due to the true pore-forming activity as the swelling rate did not increase with increases in protein in contrast to the situation with the complete OprF.
FIGURE 2
FIGURE 2. Swelling rates of proteoliposomes containing either unfractionated or open conformer-enriched OprF in sugars of different sizes
Proteoliposomes were made either with 40 μg of the unfractionated OprF (◆) or with 9.6 μg of the open conformer-enriched OprF (■), and osmotic swelling rates were measured in isotonic solutions of l-arabinose (Mr 150), d-glucose (Mr 180), N-acetyl-d-glucosamine (Mr 221), and sucrose (Mr 342). Each data point represents the average of three experiments. The results are expressed as relative rates with the swelling rates in l-arabinose taken as 100. The actual swelling rates in l-arabinose were 0.181 and 0.165 A400/min with proteoliposomes containing unfractionated and enriched OprF proteins, respectively.
FIGURE 3
FIGURE 3. Typical ion current recording obtained from a lipid bilayer after addition of ∼50 ng of the single domain-enriched OprF fraction to 1.5 ml of aqueous phase in the cis compartment of the bilayer chamber
Applied voltage was −150 mV; aqueous solution of 1 m KCl was buffered at pH 7.4 with 5 mm Tris. Two consecutive insertions of independent single channels are seen. The time resolution for this recording was 50 ms, meaning that the signal from the amplifier output was filtered by averaging over this time interval.
FIGURE 4
FIGURE 4. Typical recording of the current through a single OprF channel obtained at applied voltages of −150 mV (three uppermost tracks) and +150 mV (the lowermost track)
The time resolution for the uppermost and lowermost tracks was 10 ms. At the negative voltage (upper tracks), the channel exhibits two well defined conductance levels (Llow and Lhigh), whereas at the positive voltage (the lower track) it stays in its weakly conductive conformation (Llow). The two central panels represent several arbitrarily chosen events of flickering between Llow and Lhigh when the time resolution was increased to 20 μs (see text for details). Note the presence of an additional intermediate conductance level (Lintermediate).
FIGURE 5
FIGURE 5. The noisy track of the weakly conductive state of a single OprF channel in Fig. 4 is represented by fast fluctuations between the two sublevels and (A), which differ by about 6 pA (see inset) and are characterized by a two-peak current histogram (B)
Data were obtained at −150 mV.
FIGURE 6
FIGURE 6
A, conductance as a function of applied voltage for a single OprF channel in the weakly conductive Llow (which is represented by Llow(1) and Llow(2) averaged by filtering over a time interval of 0.1 s, (●) and highly conductive Lhigh (○) substates. The fast flickering events of OprF channel between the Llow and Lhigh states were observable only at negative voltages (see Fig. 4 for illustration), so the data for positive voltages are absent. B, reproducibility of conductance measurements from channel to channel in the weakly conductive (Llow, left) and highly conductive states (Lhigh, right). Applied voltage was −150 mV.
FIGURE 7
FIGURE 7. Power spectral density of noise in the current through a single OprF channel
The background spectrum (curve 1) was measured for the membrane with a single OprF channel at 0 mV. Curve 2 represents current fluctuations within Llow level, that is spontaneous transitions between sublevels Llow(1) and Llow(2) (see Fig. 5 for illustration). Transitions between Llow and Lhigh were excluded from this analysis. Curve 3 represents spectral analysis of a “raw” current recording that included transitions between Llow and Lhigh (see Fig. 4, the uppermost current recording).
FIGURE 8
FIGURE 8. Kinetic parameters of OprF fluctuations: the characteristic times (A), number of events (transitions from Llow to Lhigh and back) per second (B), and probability of finding the OprF channel in the highly conductive state (C) as functions of applied voltage
FIGURE 9
FIGURE 9. Conductance of a single OprF channel in Llow(●) and Lhigh (○) subconformations in the presence of differently sized PEGs normalized to its conductance in the polymer-free solution
The x axis gives the average molecular weights of PEG as specified by its manufacturer. The results are compared with the OmpF data (■) obtained earlier (13). Each point for OprF represents at least three different experiments where a single channel was first reconstituted and recorded in the polymer-free solution, which was then substituted by the polymer-containing solution. The horizontal dotted line shows the PEG effect on the bulk solution conductivity. Measurements were done at −150 mV applied voltage.
FIGURE 10
FIGURE 10. Currents through lipid bilayers in the presence of different concentrations of the single domain-enriched OprF fraction in the membrane-bathing solution
The dashed lines correspond to zero current. At a relatively high protein concentration (A) insertions of OprF oligomers are seen. Arrows 1, 2, and 3 mark ∼0.9-, ∼2.1-, and ∼8-nS conductance increments, correspondingly. At lower OprF concentrations (B), 2–3 channels were recorded.

References

    1. Hancock REW, Nikaido H. J Bacteriol. 1978;136:381–390. - PMC - PubMed
    1. Hancock REW, Decad GM, Nikaido H. Biochim Biophys Acta. 1979;554:323–331. - PubMed
    1. Yoshimura F, Zalman LS, Nikaido H. J Biol Chem. 1983;258:2308–2314. - PubMed
    1. Nikaido H, Nikaido K, Harayama S. J Biol Chem. 1991;266:770–779. - PubMed
    1. Bellido F, Martin NL, Siehnel RJ, Hancock REW. J Bacteriol. 1992;174:5196–5203. - PMC - PubMed

LinkOut - more resources