. 2006 Aug 15;91(4):1264-87.
doi: 10.1529/biophysj.105.073296. Epub 2006 Apr 14.

Dynamics of muscle glycogenolysis modeled with pH time course computation and pH-dependent reaction equilibria and enzyme kinetics

Affiliations

Dynamics of muscle glycogenolysis modeled with pH time course computation and pH-dependent reaction equilibria and enzyme kinetics

Kalyan Vinnakota et al. Biophys J. .

Abstract

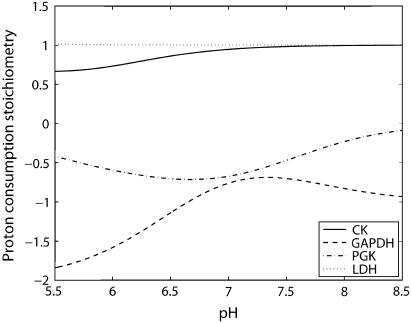
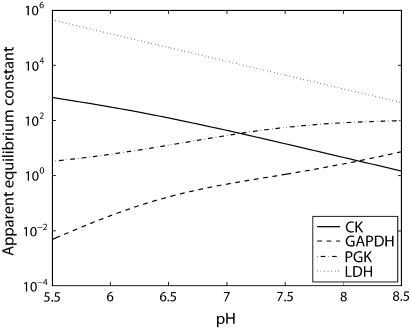
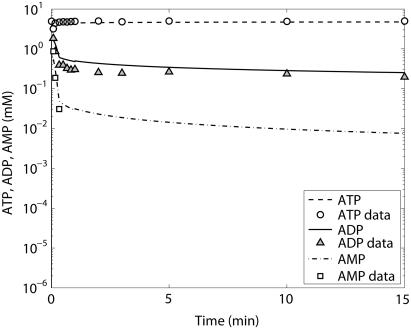
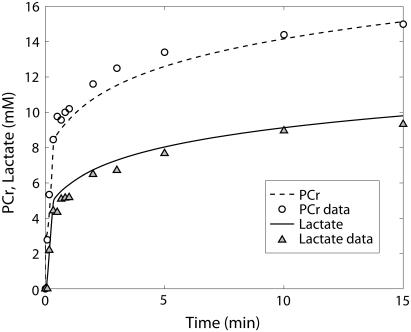
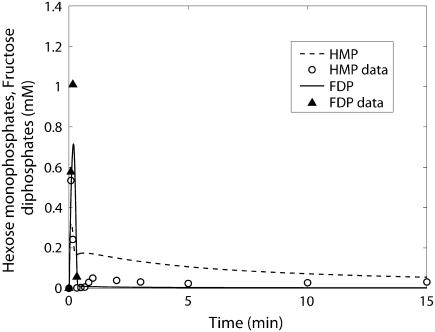
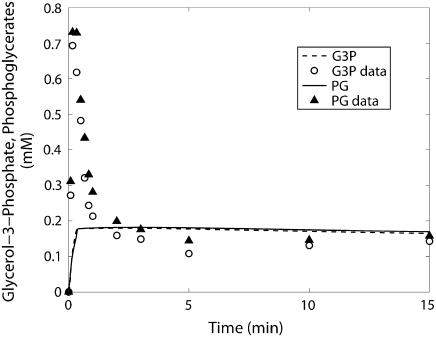
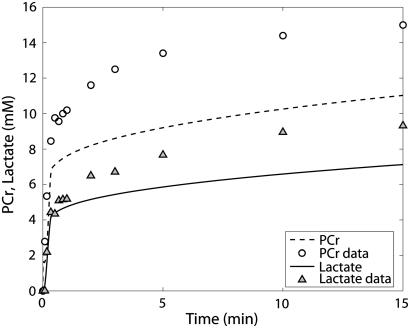
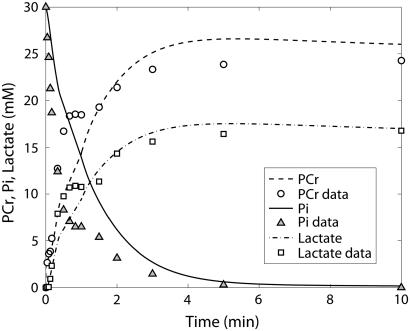
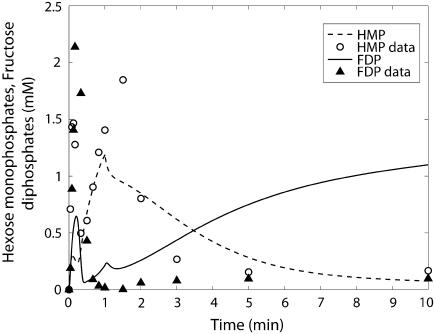
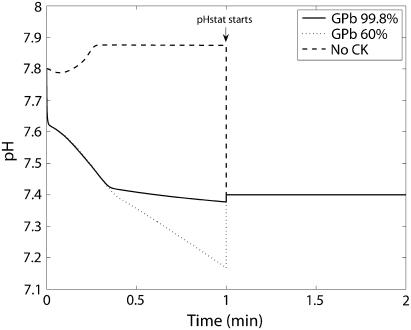
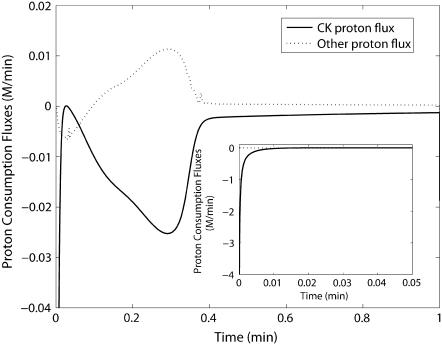
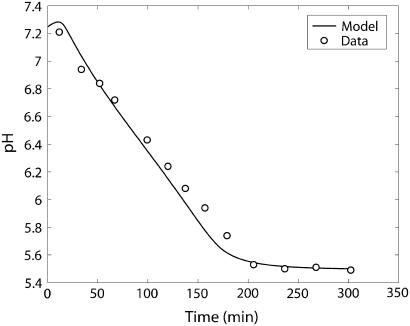
Cellular metabolites are moieties defined by their specific binding constants to H+, Mg2+, and K+ or anions without ligands. As a consequence, every biochemical reaction in the cytoplasm has an associated proton stoichiometry that is generally noninteger- and pH-dependent. Therefore, with metabolic flux, pH is altered in a medium with finite buffer capacity. Apparent equilibrium constants and maximum enzyme velocities, which are functions of pH, are also altered. We augmented an earlier mathematical model of skeletal muscle glycogenolysis with pH-dependent enzyme kinetics and reaction equilibria to compute the time course of pH changes. Analysis shows that kinetics and final equilibrium states of the closed system are highly constrained by the pH-dependent parameters. This kinetic model of glycogenolysis, coupled to creatine kinase and adenylate kinase, simulated published experiments made with a cell-free enzyme mixture to reconstitute the network and to synthesize PCr and lactate in vitro. Using the enzyme kinetic and thermodynamic data in the literature, the simulations required minimal adjustments of parameters to describe the data. These results show that incorporation of appropriate physical chemistry of the reactions with accurate kinetic modeling gives a reasonable simulation of experimental data and is necessary for a physically correct representation of the metabolic network. The approach is general for modeling metabolic networks beyond the specific pathway and conditions presented here.


Figures

FIGURE 1
FIGURE 1
Variation in the net proton stoichiometry with pH for four selected biochemical reactions. Units of the ordinate scale is mole of H+ per mole of advancement of the reaction to the right as defined in Table 3; positive means protons are consumed. Stoichiometries are computed using Eq. 7.
FIGURE 2
FIGURE 2
Apparent equilibrium constants of CK, LDH, PGK, and GAPDH reactions plotted on logarithmic scale as a function of pH at 0.51 mM free Mg2+, 80 mM free K+, 303.15 K, and I = 0.1 M. The apparent equilibrium constants computed using Eq. 28 are dimensionless, assuming a 1 M reference concentration for all species.
FIGURE 3
FIGURE 3
ATP (○), ADP (▴), and AMP (□) time course data and model simulations from Scopes (14) for Experiment 29: 99.8% GPb.
FIGURE 4
FIGURE 4
PCr (○) and lactate (▴) time course data and model simulations from Scopes (14) for Experiment 29: 99.8% GPb.
FIGURE 5
FIGURE 5
Hexose monophosphates (○) and fructose diphosphate (▴) time course data and model simulations from Scopes (14) for Experiment 29: 99.8% GPb.
FIGURE 6
FIGURE 6
Glycerol-3-phosphate (○) and phosphoglycerates (▴) time course data and model simulations from Scopes (14) for Experiment 29: 99.8% GPb.
FIGURE 7
FIGURE 7
PCr (○) and lactate (▴) time course data from Scopes (14) for Experiment 29: 99.8% GPb and model predictions when pH is fixed at 7.0 throughout the simulation with the same parameter set as in the Fig. 4. The significant deviation of model predictions from the data emphasizes the importance of including pH regulation of enzyme activities and biochemical reaction thermodynamics in the model.
FIGURE 8
FIGURE 8
PCr (○), lactate (□), and Pi (▴) time course data and model simulations from Scopes (14) for Experiment 29: 60% GPb.
FIGURE 9
FIGURE 9
Hexose monophosphates (○) and fructose diphosphate (▴) time course data and model simulations from Scopes (14) for Experiment 29: 60% GPb.
FIGURE 10
FIGURE 10
Predicted pH time courses for Experiment 29 at both 99.8% and 60% GPb and for CK knockout. A pH-stat is operated at 7.4 starting at the end of the first minute. Note the greater fall in pH for 60% GPb owing to higher creatine phosphorylation flux. The pH transient goes in alkaline direction for CK knockout since the fluxes other than creatine phosphorylation are alkalinizing.
FIGURE 11
FIGURE 11
Predicted H+ consumption flux time courses for Experiment 29 at 99.8% GPb. Inset shows the full range of CK proton consumption flux transient in the first 0.05 min. Note ∼100-fold difference in scale between main graph and inset.
FIGURE 12
FIGURE 12
Model-predicted and experimentally measured (○) time courses in the postmortem glycolysis simulation experiment.
FIGURE 13
FIGURE 13
Model-predicted proton consumption flux time courses in the postmortem glycolysis simulation experiment.
FIGURE 14
FIGURE 14
Row and column normalized grayscale image maps of mean-square error sensitivity maps of the nine variables with respect to all kinetic parameters in Experiment 29: GPb 99.8% are shown respectively in the left- and right-hand panels. Columns 19 represent the nine measurements: 1, PCr; 2, lactate; 3, ATP; 4, ADP; 5, AMP; 6, hexose monophosphates; 7, fructose diphosphates; 8, glycerol-3-phosphate; and 9, phosphoglycerates. The rows correspond to enzyme kinetic parameters and are labeled with the abbreviated enzyme name at the start of each enzyme's parameter group, which is the Vmax of that enzyme. The rest of the kinetic and allosteric parameters are all included in the Supplementary Material and follow their order of presentation in a detailed tabular form defining all of the parameters and their values. After the enzyme kinetic parameters, sensitivities with respect to ionic-strength I followed by the buffer concentrations are shown in the figure.
FIGURE 15
FIGURE 15
PCr (○) and Pi (▴) time course data and model simulations from Scopes (14) for Experiment 45 with increasing GPa fractions and added ATPase at 110 min.
FIGURE 16
FIGURE 16
(A) Model predictions of PCr and lactate time courses with no CK activity, starting with 5 mM ADP and 1 nM ATP at conditions of Experiment 29: GPb 99.8%. Note the rapid rise of lactate and no PCr synthesis. (B) Model predictions of ATP, ADP, and AMP time courses with no CK activity, starting with 5 mM ADP and 1 nM ATP at conditions of Experiment 29: GPb 99.8%. Note the rapid synthesis of ATP, and the consequent drop in ADP and AMP. Glycolytic flux is generating ATP, without creatine phosphorylation.
FIGURE 17
FIGURE 17
(A) Metabolic proton load and lactate production during Experiment 29: GPb 99.8%. Metabolic proton load was computed by solving the equation formula image and lactate production by solving Eq. 67. (B) Metabolic proton load and lactate production with no CK activity, starting with 5 mM ADP and 1 nM ATP at conditions of Experiment 29: GPb 99.8%.

References

    1. Rutman, R. J., and P. George. 1961. Hydrogen ion effects in high-energy phosphate reactions. Proc. Natl. Acad. Sci. USA. 47:1094–1109. - PMC - PubMed
    1. George, P., and R. J. Rutan. 1960. The high energy phosphate bond. Concept. Prog. Biophys. Biophys. Chem. 10:2–53. - PubMed
    1. George, P., R. C. Phillips, and R. J. Rutman. 1963. Estimates of thermodynamic data for the formation of Mg2+ complexes of ATP and ADP at zero ionic strength. Biochemistry. 2:508–512. - PubMed
    1. Smith, R. M., and R. A. Alberty. 1956. The apparent stability constants of ionic complexes of various adenosine phosphates with divalent cations. J. Am. Chem. Soc. 78:2376–2384.
    1. Alberty, R. A. 2004. A short history of the thermodynamics of enzyme-catalyzed reactions. J. Biol. Chem. 279:27831–27836. - PubMed

Publication types

Substances