. 2006 Jul 1;91(1):217-26.
doi: 10.1529/biophysj.106.081398. Epub 2006 Apr 14.

Mechanical properties of pore-spanning lipid bilayers probed by atomic force microscopy

Affiliations

Mechanical properties of pore-spanning lipid bilayers probed by atomic force microscopy

Siegfried Steltenkamp et al. Biophys J. .

Abstract

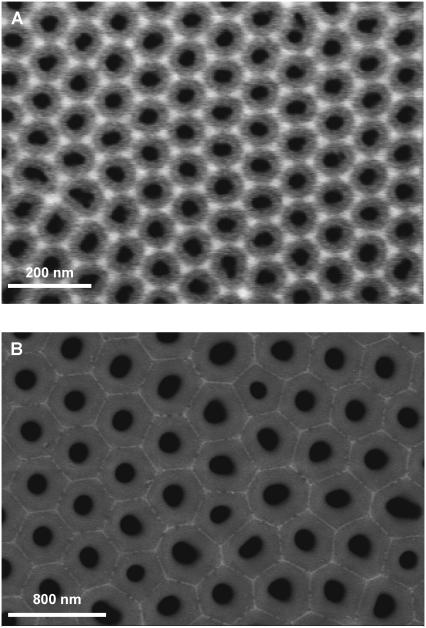
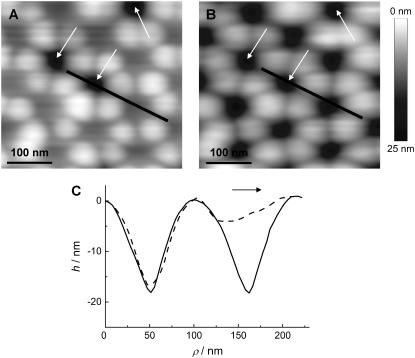
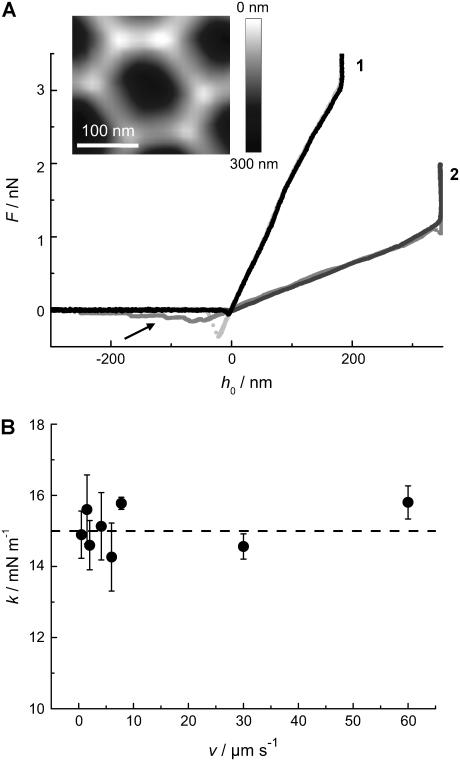
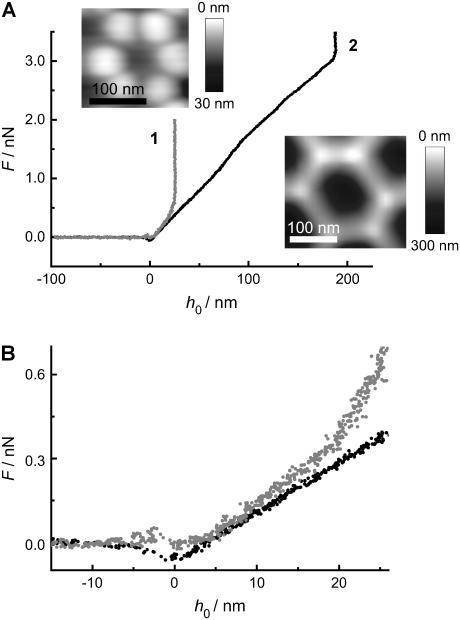
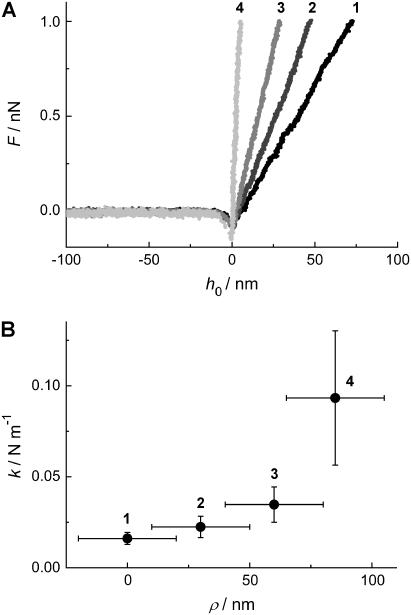
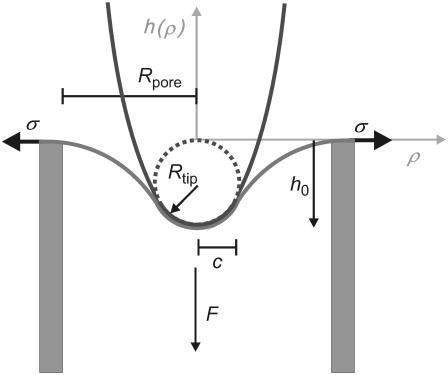
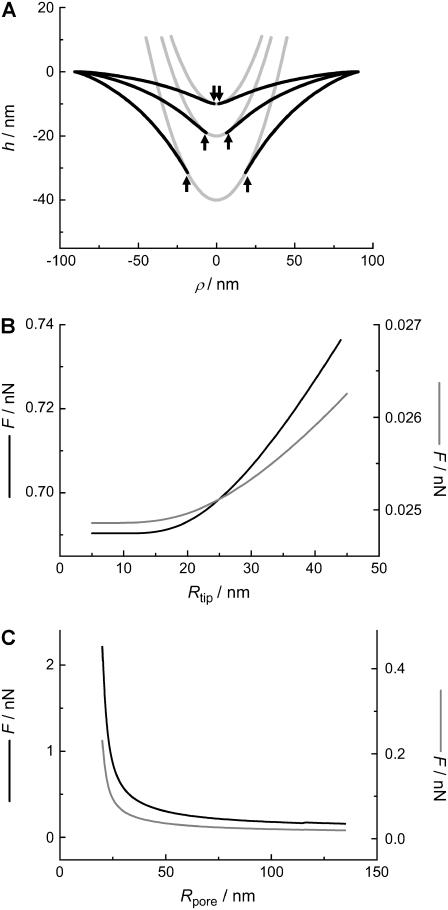
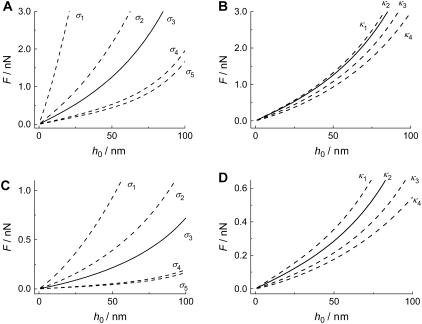
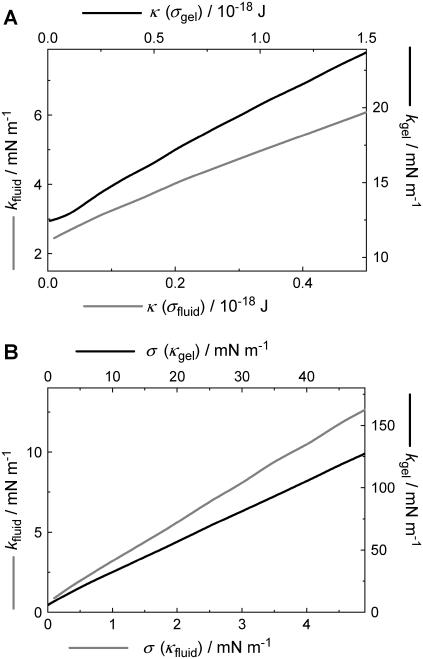
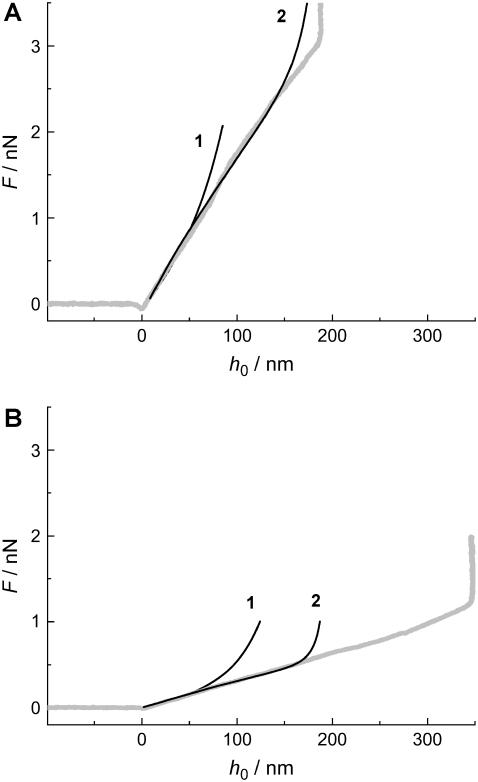
We measure the elastic response of a free-standing lipid membrane to a local indentation by using an atomic force microscope. Starting point is a planar gold-coated alumina substrate with a chemisorbed 3-mercaptopropionic acid monolayer displaying circular pores of very well defined and tunable size, over which bilayers composed of N,N,-dimethyl-N,N,-dioctadecylammonium bromide or 1,2-dioleoyl-3-trimethylammonium-propane chloride were spread. Centrally indenting these "nanodrums" with an atomic force microscope tip yields force-indentation curves, which we quantitatively analyze by solving the corresponding shape equations of continuum curvature elasticity. Since the measured response depends in a known way on the system geometry (pore size, tip radius) and on material parameters (bending modulus, lateral tension), this opens the possibility to monitor local elastic properties of lipid membranes in a well-controlled setting.


Figures

FIGURE 1
FIGURE 1
Scanning electron micrographs of highly ordered gold-coated porous alumina used as the substrate for pore-spanning DODAB and DOTAP bilayers. The average pore radius in A is (33 ± 2) nm with an overall porosity of (34 ± 6)%, whereas in B an average pore radius of (90 ± 5) nm and a porosity of (16 ± 5)% is found.
FIGURE 2
FIGURE 2
Visualization of pore-spanning bilayers by AFM (contact mode in aqueous solution). (A) Pores covered by a DODAB bilayer imaged at low forces (0.9 nN). The arrows indicate uncovered pores. (B) Same region imaged at larger forces (2.7 nN). (C) Height profiles along the line shown in A, dashed line, and B, solid line, imaged at two different forces using NP-S cantilevers. Scan direction was from left to right as indicated by the arrow.
FIGURE 3
FIGURE 3
(A) Force-indentation curves taken in the center of a pore (inset) with Rpore = 90 nm (indentation (black) and retraction (light gray) of a DODAB bilayer (1) using an Olympus PSA 400 cantilever with a nominal spring constant of 0.02 N m−1; indentation (black) and retraction (gray) of a DOTAP-bilayer (2) using an Olympus Biolever with a nominal spring constant of 0.006 N m−1). The use of different cantilevers explains the difference in maximal penetration depth. The arrow denotes the occurrence of DOTAP tethers pulled from the surface. (B) Apparent “spring constant” k of a DODAB bilayer spanning a pore with a radius of 90 nm as a function of the vertical cantilever velocity. The dashed line represents the mean value of k. Each data point represents the average of more than 10 force-indentation curves.
FIGURE 4
FIGURE 4
(A) Force-indentation curve of a DODAB bilayer taken in the center of a pore (insets) with (1) Rpore = 33 nm and (2) Rpore = 90 nm. (B) Magnification of figure A emphasizing the different slopes.
FIGURE 5
FIGURE 5
(A) Force-indentation curves of a pore-spanning DODAB bilayer on pores with Rpore = 90 nm taken at different positions starting from the center (1) of the pore to the rim (4). (B) The average slope of more than 10 curves taken at each location as a function of the position ρ from the pore center (1) to the rim (4). The error bars originate from several independent force-indentation curves taken at the same spot.
FIGURE 6
FIGURE 6
Illustration of the parameters used for modeling a parabolic tip poking into a membrane spanned over a hole of radius Rpore. c denotes the axial distance of the contact point between membrane and tip, σ the lateral tension, Rtip the radius of curvature of the tip, h0 the penetration depth in the pore center, F the normal force exerted by the tip, and h(ρ) the shape of the membrane as a function of displacement from the center of the pore.
FIGURE 7
FIGURE 7
(A) Calculated membrane shape (small gradient approximation) as a function of maximum penetration depth (10 nm, 20 nm, 40 nm), using the parameters Rtip = 20 nm and Rpore = 90 nm, assuming a fluid membrane (σfluid = 1.0 mN m−1, κfluid = 0.1·10−18 J). The arrows indicate the point c of detachment between tip and membrane. (B) Force F to maintain a constant penetration depth h0 = 10 nm as a function of the tip radius Rtip using typical parameters for a membrane in the gel (black line) and fluid phase (gray line); parameters: σgel = 5.0 mN m−1, κgel = 1.0·10−18 J, σfluid = 1.0 mN m−1, κfluid = 0.1·10−18 J, and Rpore = 90 nm. (C) Force F at h0 = 10 nm as a function of the pore radius Rpore for a membrane in the gel (black line) and fluid phase (gray line) using the following parameters: Rtip = 20 nm, σgel = 5.0 mN m−1, κgel = 1.0·10−18 J, κfluid = 0.1·10−18 J, and σfluid = 1.0 mN m−1.
FIGURE 8
FIGURE 8
(A) Calculated force-indentation plots of a gel phase membrane with a bending modulus of κgel = 1.0·10−18 J and varied surface tension (σ1…5 = 50 mN m−1; 10 mN m−1; 5.0 mN m−1; 1.0 mN m−1; 0.5 mN m−1). (B) Force-indentation plot of a membrane at fixed surface tension (σgel = 5.0 mN m−1) and variable bending modulus (κ1…4 = 1.2·10−18 J; 1.0·10−18 J; 0.5·10−18 J; 0.1·10−18 J). (C) Indentation of a fluid membrane (κfluid = 0.1·10−18 J) exhibiting variable surface tension (σ1…5 = 5.0 mN m−1; 2.0 mN m−1; 1.0 mN m−1; 0.1 mN m−1; 0.05 mN m−1). (D) Indentation of a membrane (σfluid = 1.0 mN m−1) with various bending moduli (κ1…4 = 0.5·10−18 J; 0.3·10−18 J; 0.1·10−18 J; 0.01·10−18 J). All curves were calculated using the small gradient approximation.
FIGURE 9
FIGURE 9
Calculated apparent “spring constant” of the membrane, k, as a function of bending modulus and surface tension in two different regimes (kgel, kfluid) representing membranes in the fluid and in the gel phase. (A) k as a function of bending modulus with either σfluid = 1.0 mN m−1 or σgel = 5.0 mN m−1. (B) k as a function of surface tension with either κfluid = 0.1·10−18 J or κgel = 1.0·10−18 J.
FIGURE 10
FIGURE 10
(A) Force-indentation curve of a membrane in the gel phase (DODAB) covering a pore with a radius of Rpore = 90 nm. 1 represents the solution calculated using the small gradient approximation, whereas 2 shows the exact solution. In both cases, the following parameters were used: Rtip = 20 nm, Rpore = 90 nm, σgel = 5.0 mN m−1, and κgel = 1.0·10−18 J. (B) The same parameters as in A, but this time for a DOTAP membrane, using the following parameters: Rtip = 20 nm, Rpore = 90 nm, σfluid = 1.0 mN m−1, and κfluid = 0.1·10−18 J.

Similar articles

Cited by

References

    1. Alessandrini, A., and P. Facci. 2005. AFM: a versatile tool in biophysics. Meas. Sci. Technol. 16:R65–R92.
    1. Butt, H.-J., B. Cappella, and M. Kappl. 2005. Force measurements with the atomic force microscope: Technique, interpretation and applications. Surf. Sci. Rep. 59:1–152.
    1. Janshoff, A., M. Neitzert, Y. Oberdörfer, and H. Fuchs. 2000. Force spectroscopy of molecular systems - single molecule spectroscopy of polymers and biomolecules. Angew. Chem. Int. Ed. Engl. 39:3346–3374. - PubMed
    1. Janshoff, A., and C. Steinem. 2001. Scanning force microscopy of artificial membranes. ChemBioChem. 2:798–808. - PubMed
    1. Boal, D. 2002. Mechanics of the Cell. Cambridge University Press, Cambridge.

Publication types

LinkOut - more resources