. 2006 Jul 1;91(1):298-310.
doi: 10.1529/biophysj.106.081547. Epub 2006 Apr 14.

Increasing the net charge and decreasing the hydrophobicity of bovine carbonic anhydrase decreases the rate of denaturation with sodium dodecyl sulfate

Affiliations

Increasing the net charge and decreasing the hydrophobicity of bovine carbonic anhydrase decreases the rate of denaturation with sodium dodecyl sulfate

Katherine L Gudiksen et al. Biophys J. .

Abstract

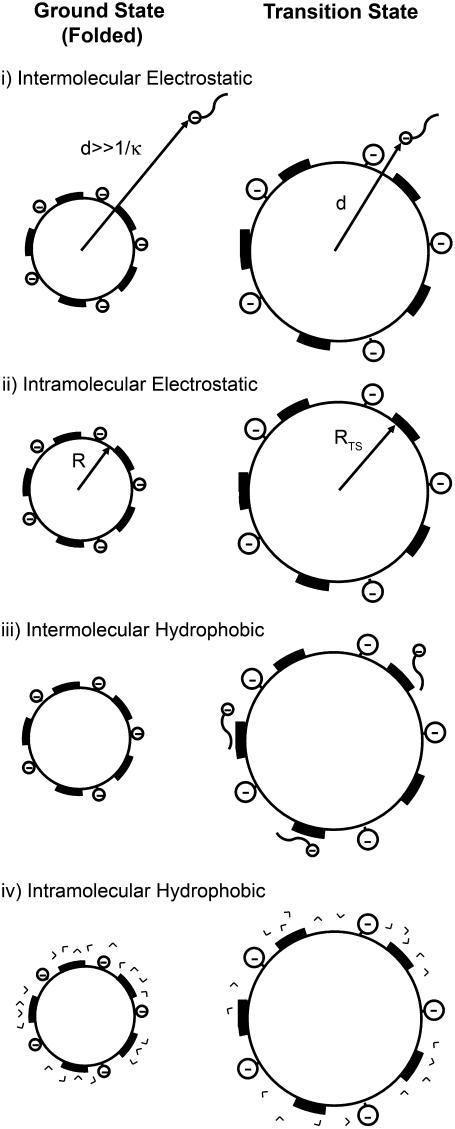
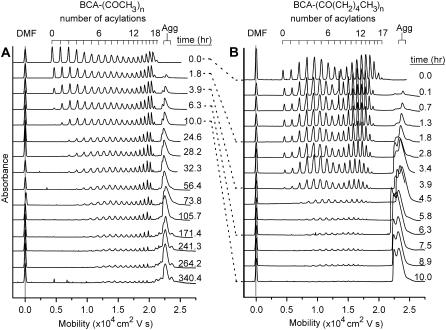
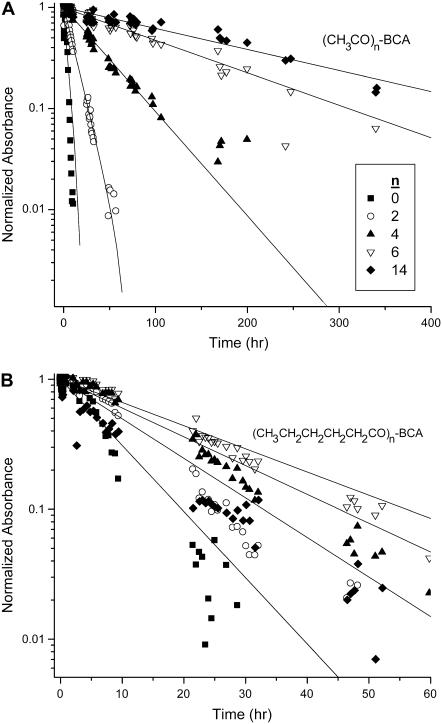
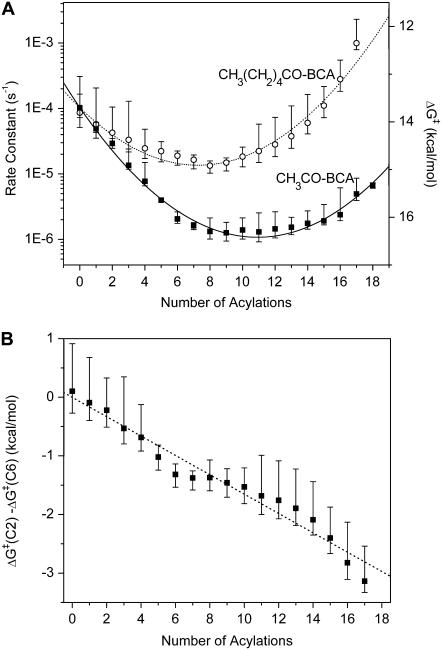
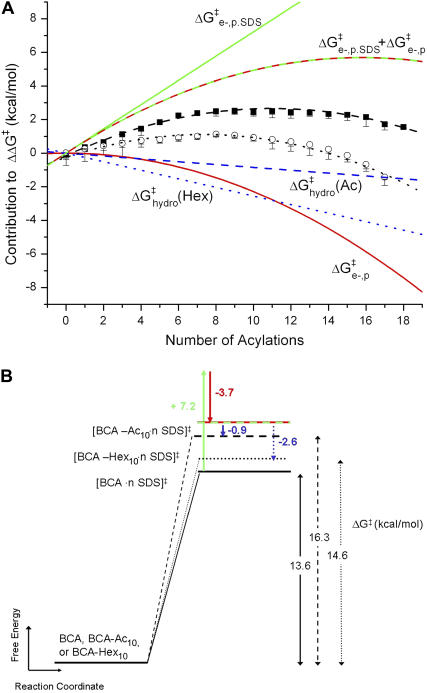
This study compares the rate of denaturation with sodium dodecyl sulfate (SDS) of the individual rungs of protein charge ladders generated by acylation of the lysine epsilon-NH3+ groups of bovine carbonic anhydrase II (BCA). Each acylation decreases the number of positively charged groups, increases the net negative charge, and increases the hydrophobic surface area of BCA. This study reports the kinetics of denaturation in solutions containing SDS of the protein charge ladders generated with acetic and hexanoic anhydrides; plotting these rates of denaturation as a function of the number of modifications yields a U-shaped curve. The proteins with an intermediate number of modifications are the most stable to denaturation by SDS. There are four competing interactions-two resulting from the change in electrostatics and two resulting from the change in exposed hydrophobic surface area-that determine how a modification affects the stability of a rung of a charge ladder of BCA to denaturation with SDS. A model based on assumptions about how these interactions affect the folded and transition states has been developed and fits the experimental results. Modeling indicates that for each additional acylation, the magnitude of the change in the activation energy of denaturation (DeltaDeltaG(double dagger)) due to changes in the electrostatics is much larger than the change in DeltaDeltaG(double dagger) due to changes in the hydrophobicity, but the intermolecular and intramolecular electrostatic effects are opposite in sign. At the high numbers of acylations, hydrophobic interactions cause the hexanoyl-modified BCA to denature nearly three orders of magnitude more rapidly than the acetyl-modified BCA.


Figures

FIGURE 1
FIGURE 1
Schematic representation of the four factors discussed in the text for the model of protein denaturation. The protein is represented as a sphere with uniformly distributed negative charge on its surface. The dark patches represent hydrophobic regions on the surface of the protein that result from acylations. The depictions of SDS molecules are wavy lines (dodecanoic chain) with negatively charged headgroups (sulfate group). V-shaped entities represent water molecules.
FIGURE 2
FIGURE 2
Denaturation of hydrophobic charge ladders of (A) BCA-Acn and (B) BCA-Hexn. Dimethylformamide was used as a neutral marker of electroosmotic flow. Each ladder is labeled with the time elapsed after placing the dialysis cassette containing protein in the solution of SDS; the dotted lines match up measurements of BCA-Acn and BCA-Hexn measured at the same amount of elapsed time. The peak corresponding to denatured, aggregated BCA-SDS is labeled (Agg) and has fine structure; this structure may be due to different denatured states of the BCA-SDS aggregate.
FIGURE 3
FIGURE 3
Corrected areas (see text for details) as a function of time for representative rungs of (A) an BCA-Acn charge ladder and (B) a BCA-Hexn charge ladder. Deviations from linearity could be due to the fact that each rung of the charge ladder is made up of a mixture of regioisomers that may have different rates of denaturation. The data shown in this figure are from one experiment. (It is difficult to give experimental uncertainties to the points on the graph because the time at which the points were taken differed between repetitions of the experiment.)
FIGURE 4
FIGURE 4
(A) Rate constants of denaturation for both (▪) BCA-Acn and (○) BCA-Hexn charge ladders with SDS as a function of the number of acylations. The points are the arithmetic average and the error bars are minimum and maximum values measured in three repetitions for BCA-Acn and four repetitions for BCA-Hexn. The right y axis shows the corresponding ΔG in kcal/mol calculated using Eq. 1. The lines show fits of the equation ΔG = a + bn + cn2 to the data; see text for discussion of this model. (B) A plot of the difference in ΔG between a rung of an acetyl ladder and a hexanoyl ladder as a function of rung number. The data fit a line (slope = 0.17 kcal/mol, R2 = 0.97). The fit of these data to a linear plot (dotted lines) suggests that the difference in ΔG between the two ladders is only due to the difference in the linear term bn; the c coefficient includes only electrostatic contributions to ΔG.
FIGURE 5
FIGURE 5
(A) Contributions to ΔΔG from formula image (green line), formula image (red line), and formula image (blue line; dashed line, Acn, and dotted line, Hexn). The sum of the electrostatic contributions is marked as the red-green dashed line. The data for ΔΔG—the sum of the four components—are shown for BCA-Acn (▪) and BCA-Hexn (○). The fits to the data (dashed line, BCA-Acn; dotted line, BCA-Hexn) are those given by Eq. 9. See text for details of the model. (B) An example of how the energy of the transition state changes relative to that of the ground state with 10 modifications. The folded states of BCA, BCA-Ac10, and BCA-Hex10 are scaled to the same energy. The arrows (in the same colors as A) indicate how each of the factors changes the relative position of the transition state. The red/green dashed line shows the effects of just the electrostatic terms on the energy of the transition state (i.e., if 10 lysine groups were neutralized with no corresponding change in hydrophobicity).

References

    1. Gallagher, S. R. 2005. One-dimensional SDS gel electrophoresis of proteins. In Current Protocols in Molecular Biology. F. M. Ausubel, R. Brent, R. E. Kingston, D. D. Moore, J. G. Seidman, J. A. Smith, and K. Struhl, editors. John Wiley & Sons, New York. 10.2A.1–10.2A.34.
    1. Rigaud, J. L., M. Chami, O. Lambert, D. Levy, and J. L. Ranck. 2000. Use of detergents in two-dimensional crystallization of membrane proteins. Biochim. Biophys. Acta. 1508:112–128. - PubMed
    1. le Maire, M., P. Champeil, and J. V. Moller. 2000. Interaction of membrane proteins and lipids with solubilizing detergents. Biochim. Biophys. Acta. 1508:86–111. - PubMed
    1. Jones, M. N. 1999. Surfactants in membrane solubilisation. Int. J. Pharm. 177:137–159. - PubMed
    1. Svenson, S. 2004. Controlling surfactant self-assembly. Curr. Opin. Colloid Interface Sci. 9:201–212.

Publication types

LinkOut - more resources