. 2006 Apr 25;103(17):6670-5.
doi: 10.1073/pnas.0601989103. Epub 2006 Apr 14.

MTA1, a transcriptional activator of breast cancer amplified sequence 3

Affiliations

MTA1, a transcriptional activator of breast cancer amplified sequence 3

Anupama E Gururaj et al. Proc Natl Acad Sci U S A. .

Erratum in

  • Proc Natl Acad Sci U S A. 2013 Mar 5;110(10):4147-8

Abstract

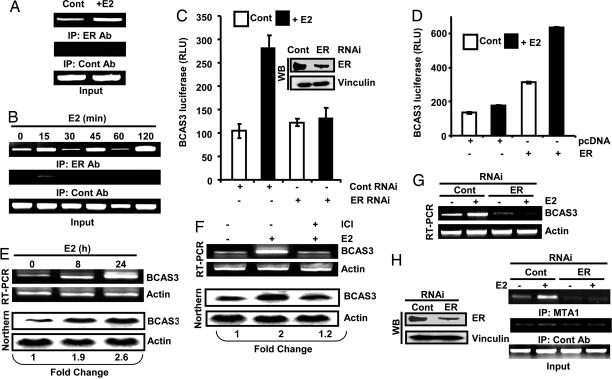
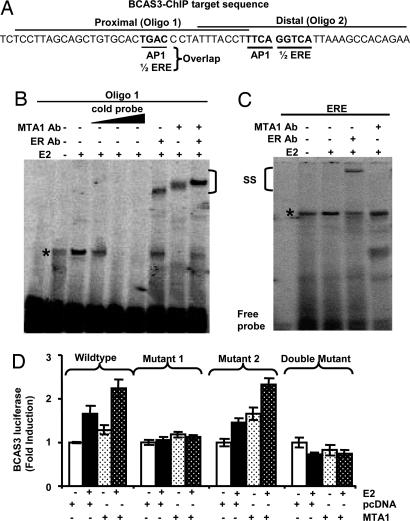
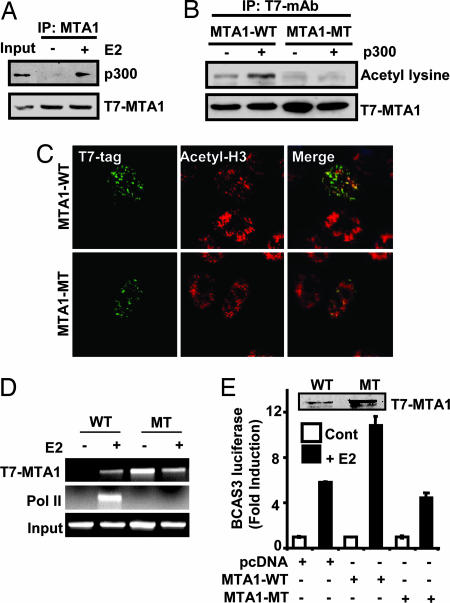
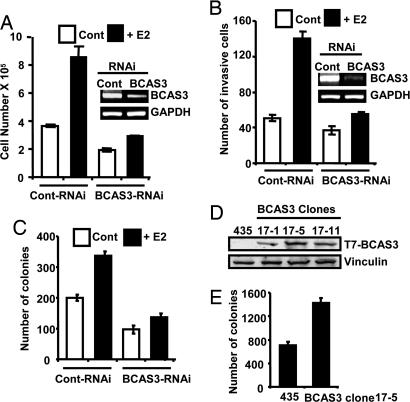
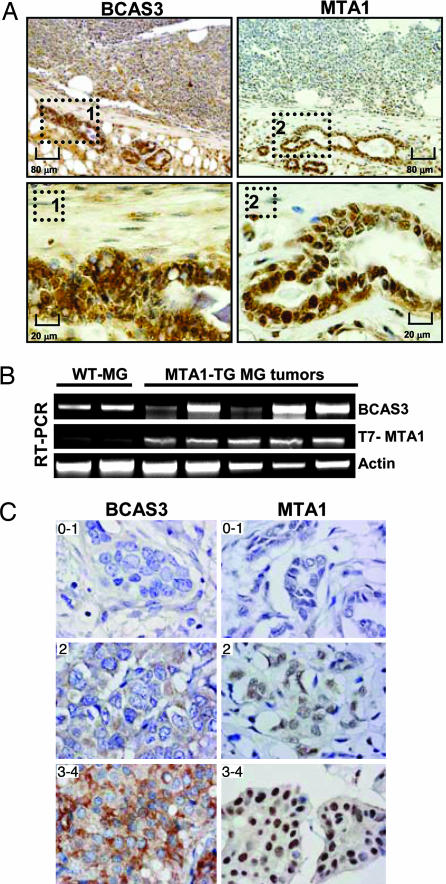
Here we define a function of metastasis-associated protein 1 (MTA1), a presumed corepressor of estrogen receptor alpha (ERalpha), as a transcriptional activator of Breast Cancer Amplified Sequence 3 (BCAS3), a gene amplified and overexpressed in breast cancers. We identified BCAS3 as a MTA1 chromatin target in a functional genomic screen. MTA1 stimulation of BCAS3 transcription required ERalpha and involved a functional ERE half-site in BCAS3. Furthermore, we discovered that MTA1 is acetylated on lysine 626, and that this acetylation is necessary for a productive transcriptional recruitment of RNA polymerase II complex to the BCAS3 enhancer sequence. BCAS3 expression was elevated in mammary tumors from MTA1 transgenic mice and 60% of the human breast tumors, and correlated with the coexpression of MTA1 as well as with tumor grade and proliferation of primary breast tumor samples. These findings reveal a previously unrecognized function of MTA1 in stimulating BCAS3 expression and suggest an important role for MTA1-BCAS3 pathway in promoting cancerous phenotypes in breast tumor cells.


Conflict of interest statement

Conflict of interest statement: No conflicts declared.

Figures

Fig. 1.
Fig. 1.
Recruitment to the regulatory region and modulation of BCAS3 by MTA1. (A) MTA1-associated chromatin from MCF-7 cells associates with regulatory region of BCAS3. (B) Levels of BCAS3 and MTA1 in MCF-7/MTA1 (T11 clone) and MCF-7/pcDNA cells. (C) Effect of MTA1 knockdown by RNAi on the levels of BCAS3. (D) Effect of T7-MTA1 or pCDNA on the BCAS3-luc activity in MCF-7 cells. Inset, expression of transfected T7-MTA1. (E) Status of BCAS3-luc activity in MCF-7/MTA1 and HC11/MTA1 clones with respective controls. (F) Recruitment of MTA1 onto BCAS3 regulatory region upon E2 stimulation. (G) BCAS3-luc reporter activity in MCF-7 cells transiently transfected with T7-MTA1 and treated with E2. (H and I) Effect of E2 treatment on BCAS3-luc activity and BCAS3 protein in MCF-7/pcDNA and MCF-7/MTA1 cells. Luciferase activity is represented as fold induction by E2 as compared to control (n = 3). (J) Effect of MTA1 depletion on BCAS3 expression in MCF-7 cells treated with or without E2 (n = 3).
Fig. 2.
Fig. 2.
Occupancy of BCAS3 enhancer module by ERα and regulation of gene expression. (A) E2 stimulation promotes ERα recruitment onto BCAS3 regulatory region in MCF-7 cells. (B) ERα occupancy of BCAS3 regulatory sequence upon E2 treatment. (C) Effect of ERα depletion upon E2 stimulation of BCAS3-luc activity in MCF-7 cells. (D) BCAS3-luc activity in HeLa cells transfected with ERα or vector and treated with E2. (E) Effect of E2 stimulation on BCAS3 mRNA in MCF-7 cells. (F) Inhibition of E2-induced BCAS3 expression by ICI-182780 in MCF-7 cells. (G) Effect of ERα knockdown on BCAS3 expression in MCF-7 cells treated with or without E2. (H) (Right) Recruitment of MTA1 onto BCAS3 regulatory region in response to E2 stimulation in ER-depleted MCF-7 cells. (Left) Status of ERα knockdown by RNAi (n = 3).
Fig. 3.
Fig. 3.
MTA1 and ERα regulate BCAS3 gene expression via an ERE half-site. (A) Schematic representation of the two ERE half-sites in BCAS3 regulatory sequence. (B) Gel-shift and supershift assay using labeled oligo in nuclear extracts from MCF-7 cells treated with E2. SS, supershift with ERα or MTA1 Abs. (C) Gel shift assay with same nuclear extracts using ERE probe. SS, supershift with MTA1 or ERα Abs. (D) Effect of MTA1 upon luciferase activity driven by WT or mutated BCAS3 on either or both ERE half-sites. Luciferase activity is represented as fold induction by E2 as compared to control (n = 3).
Fig. 4.
Fig. 4.
Identification of MTA1 as an acetylated protein. (A) CoIP and Western blot analysis showing MTA1 association with p300 in vivo. (B) MCF-7 cells transfected with T7-MTA1 or -MTA1-K626A mutant with lysine to alanine substitutions in the GKSYP motif, and p300 were IP with anti-T7 and analyzed with antibodies to acetylated lysine or T7. (C) Localization of T7- MTA1-WT or T7-MTA1-K626A (green) and acetyl-H3 (red) in MCF-7 cells. (D) MCF-7 cells transfected with MTA1-WT or MTA1-K626A mutant were treated with E2 and ChIP assay was performed with T7- MAb. Double ChIP was carried out with Pol II antibody. (E) Effect of MTA1-WT and MTA1-K626A mutant on PGL2-BCAS3-luc activity in MCF7 cells. Luciferase activity is represented as fold induction by E2 as compared to control (n = 3).
Fig. 5.
Fig. 5.
BCAS3 deregulation impacts pathophysiological effects of E2. (A) Effect of BCAS3 knockdown on MCF-7 cell proliferation in response to E2. A total of 10,000 cells per well were plated in six-well dishes, and BCAS3 knockdown was performed followed by E2 treatment. Cell number was counted 4 days later by using a Coulter Counter (n = 3). (B) BCAS3 knockdown reduces E2-induced invasion of ZR-75 cells. Cells were transfected with BCAS3 RNAi and, 48 h after transfection, 20,000 cells were loaded on the upper well of a Boyden chamber coated with matrigel. Cells that invaded the membrane were counted after 24 h (n = 9). (C) BCAS3 knockdown inhibits anchorage-independent growth of ZR-75 cells. Cells were transfected with BCAS3 RNAi and, 48 h after transfection, 10,000 cells were used for soft agar assay. The colonies were counted after 2 weeks of growth (n = 3). (D) Expression of T7-BCAS3 in stable clones. (E) BCAS3 overexpression promotes anchorage-independent growth of MDA-MB-435 cells. Conditions used were the same as described for C (n = 3).
Fig. 6.
Fig. 6.
BCAS3 deregulation in breast tumors in mice and humans. (A) Immunohistochemical analysis of BCAS3 and MTA1 expression in breast tumors from MTA1-TG mice. (Upper) Lower magnification (×100) pictures. (Lower) Higher magnifications (×400) of the same samples. (B) RT-PCR analysis of BCAS3 and T7-MTA1 in mammary tumors from MTA1-TG and WT-mouse mammary tissue. (C) BCAS3 and MTA1 staining in primary breast cancer samples. Breast cancer tissue microarrays were stained with BCAS3 and MTA1 antibodies and the staining was scored from 0 (negative) to 5 (strongest staining).

Similar articles

Cited by

References

    1. Fowler A. M., Alarid E. T. Sci. STKE. 2004;2004:e51.
    1. McKenna N. J., O'Malley B. W. Cell. 2002;108:465–474. - PubMed
    1. McKenna N. J., Lanz R. B., O'Malley B. W. Endocr. Rev. 1999;20:321–344. - PubMed
    1. Toh Y., Pencil S. D., Nicolson G. L. J. Biol. Chem. 1994;269:22958–22963. - PubMed
    1. Bowen N. J., Fujita N., Kajita M., Wade P. A. Biochim. Biophys. Acta. 2004;1677:52–57. - PubMed

Publication types

MeSH terms