Comparative Study
. 2006 Apr 25;103(17):6676-81.
doi: 10.1073/pnas.0601752103. Epub 2006 Apr 14.

Evidence for a role of developmental genes in the origin of obesity and body fat distribution

Affiliations
Comparative Study

Evidence for a role of developmental genes in the origin of obesity and body fat distribution

Stephane Gesta et al. Proc Natl Acad Sci U S A. .

Abstract

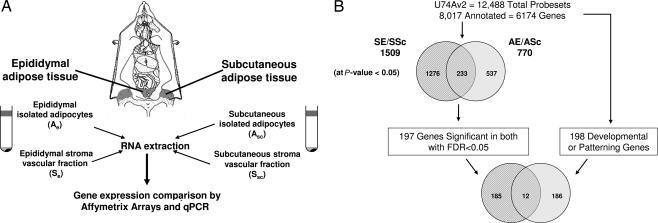
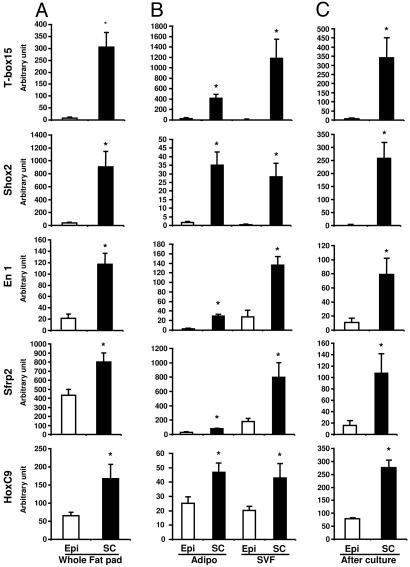
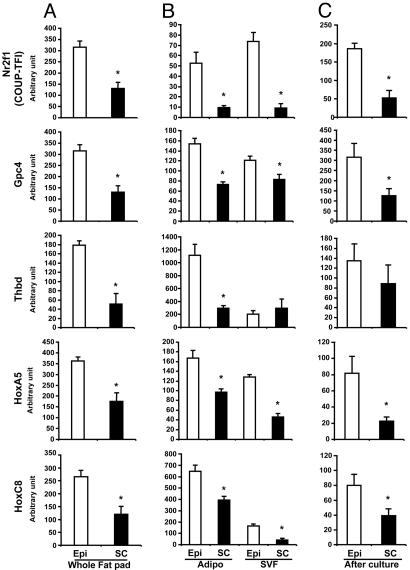
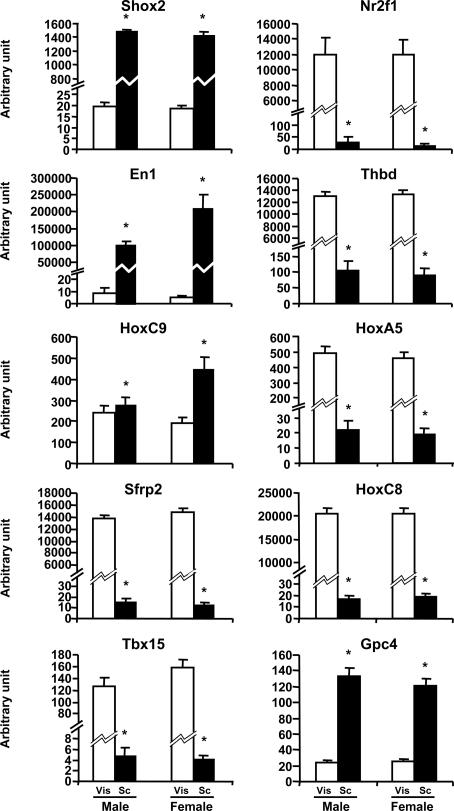
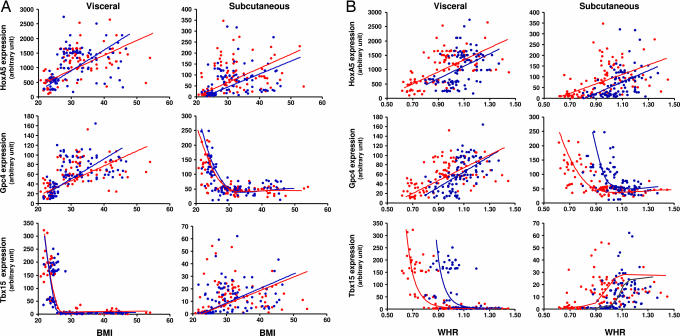
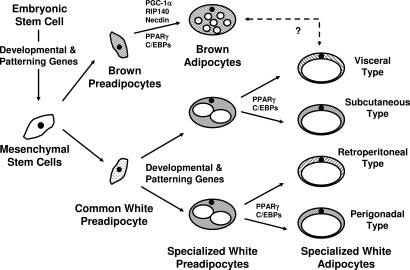
Obesity, especially central obesity, is a hereditable trait associated with a high risk for development of diabetes and metabolic disorders. Combined gene expression analysis of adipocyte- and preadipocyte-containing fractions from intraabdominal and subcutaneous adipose tissue of mice revealed coordinated depot-specific differences in expression of multiple genes involved in embryonic development and pattern specification. These differences were intrinsic and persisted during in vitro culture and differentiation. Similar depot-specific differences in expression of developmental genes were observed in human subcutaneous versus visceral adipose tissue. Furthermore, in humans, several genes exhibited changes in expression that correlated closely with body mass index and/or waist/hip ratio. Together, these data suggest that genetically programmed developmental differences in adipocytes and their precursors in different regions of the body play an important role in obesity, body fat distribution, and potential functional differences between internal and subcutaneous adipose tissue.


Conflict of interest statement

Conflict of interest statement: No conflicts declared.

Figures

Fig. 1.
Fig. 1.
Experimental design. (A) Flank s.c. and intraabdominal (epididymal) white adipose tissue were taken from 6- to 7-week-old pooled C57BL/6 males. SVF and adipocytes were isolated after collagenase digestion of adipose tissues. Equal quantities of RNA were isolated from isolated adipocytes and SVF of each fat depot. A hybridization mixture containing 15 μg of biotinylated cRNA, adjusted for possible carryover of residual total RNA, was prepared and hybridized to mouse Affymetrix U74Av2 chips. (B) Among the 12,488 probe sets present on the U74Av2 chip, 8,017 probe sets representing 6,174 are annotated for Gene Ontology Biological Process. Significant genes with differential expression in both depots were identified by selecting genes that passed two independent filters of significance (P < 0.05, Student’s t test; positive false discovery rate < 0.05) (see Materials and Methods). The first filter (P < 0.05, Student’s t test) selected 1,276 genes differentially expressed in the SVF, 537 genes differentially expressed in isolated adipocytes, and 233 genes differentially expressed in both cell fractions. Of these 233 genes, 197 genes passed the second filter of significance (positive false discovery rate < 0.05) and were assessed against an a priori set of 198 annotated genes involved in embryonic development and pattern specification (see Materials and Methods). Twelve genes from this set were found among the differentially expressed genes.
Fig. 2.
Fig. 2.
Differential expression of development genes Tbx15, Shox2, En1, Sfrp2, and HoxC9 in s.c. and intraabdominal adipose tissue, adipocytes, and SVF in mice. Comparison of Tbx15, Shox2, En1, Sfrp2, and HoxC9 gene expression between intraabdominal (Epi, open bars) and s.c. (SC, filled bars) adipose tissue of C57BL/6 mice was performed by using qPCR as described in Materials and Methods. These genes have a higher level of expression in s.c. in whole adipose tissue (A) (Epi versus Sc; ∗, P < 0.05), isolated adipocytes, and SVF (B) (Epi versus Sc; ∗, P < 0.05). These differences of expression are maintained when SVF taken from intraabdominal (epididymal) or s.c. adipose were placed in culture in a defined serum-free medium and subjected to in vitro differentiation (C), suggesting that these differences are independent of extrinsic factors (Epi versus Sc; ∗, P < 0.05).
Fig. 3.
Fig. 3.
Differential expression of developmental genes Nr2f1, Gpc4, Thbd, HoxA5, and HoxC8 in s.c. and intraabdominal adipose tissue, adipocytes, and SVF. Comparison of Nr2f1, Gpc4, Thbd, HoxA5, and HoxC8 gene expression between intraabdominal (Epi, open bars) and s.c. (SC, filled bars) adipose tissue of C57BL/6 mice was performed by using qPCR as described in Materials and Methods. These genes have a higher level of expression in intraabdominal (epidydimal) whole adipose tissue (A) (Epi versus Sc; ∗, P < 0.05), isolated adipocytes, and SVF (B) (Epi versus Sc; ∗, P < 0.05). These differences of expression are maintained when SVF taken from intraabdominal (epididymal) or s.c. adipose were placed in culture in a defined serum-free medium and subjected to in vitro differentiation (C), suggesting that these differences are independent of extrinsic factors (Epi versus Sc; ∗, P < 0.05).
Fig. 4.
Fig. 4.
Differential expression of s.c. dominant genes and intraabdominal dominant genes in s.c. and intraabdominal adipose tissue of lean humans. Visceral (Vis, open bars) and s.c. (SC, filled bars) adipose tissue biopsies were performed on 53 lean subjects (BMI < 25; 22 males and 31 females). Tbx15, Shox2, En1, Sfrp2, HoxC9, Nr2f1, Gpc4, Thbd, HoxA5, and HoxC8 expressions were compared in both depots by using qPCR as described in Materials and Methods (Vis versus SC; ∗, P < 0.05).
Fig. 5.
Fig. 5.
Expression of HoxA5, Gpc4 and Tbx15 in s.c. and visceral adipose tissue in humans are correlated with adiposity and fat distribution. One hundred ninety-eight subjects (99 males and 99 females) ranging from lean to obese with variable BMI (A) and fat distribution (WHR) (B) were subjected to visceral (Vis, open bars) and s.c. (SC, filled bars) adipose tissue biopsies. Gene expression of HoxA5, Gpc4, and Tbx15 was assessed in both fat depots by qPCR as described in Materials and Methods. Correlation significances were determined by using statview software either as linear correlations or, in the case of nonlinear correlations, by exponential or lowest curve fitting.
Fig. 6.
Fig. 6.
Hypothetical scheme of adipocyte development. PPAR, peroxisome proliferator-activated receptor.

Similar articles

Cited by

References

    1. Lean M. E. Proc. Nutr. Soc.; 2000. pp. 331–336. - PubMed
    1. Mauriege P., Despres J. P., Moorjani S., Prud’Homme D., Lamarche B., Bouchard C., Nadeau A., Tremblay A., Lupien P. J. Eur. J. Clin. Invest. 1993;23:729–740. - PubMed
    1. Gillum R. F. J. Chronic Dis. 1987;40:421–428. - PubMed
    1. Kissebah A. H., Krakower G. R. Physiol. Rev. 1994;74:761–811. - PubMed
    1. Abate N., Garg A. Prog. Lipid Res. 1995;34:53–70. - PubMed

Publication types

MeSH terms