. 2006 May 1;20(9):1123-36.
doi: 10.1101/gad.381706. Epub 2006 Apr 17.

Genome-wide mapping of Polycomb target genes unravels their roles in cell fate transitions

Affiliations

Genome-wide mapping of Polycomb target genes unravels their roles in cell fate transitions

Adrian P Bracken et al. Genes Dev. .

Abstract

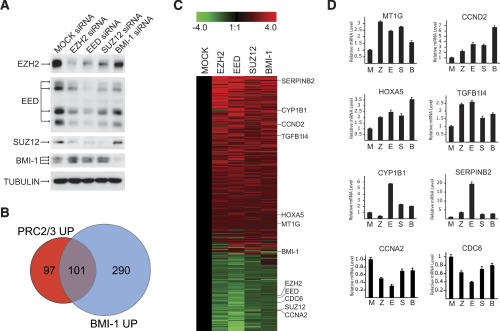
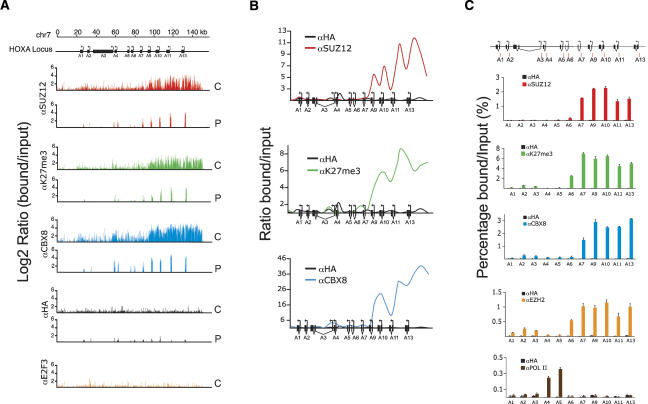
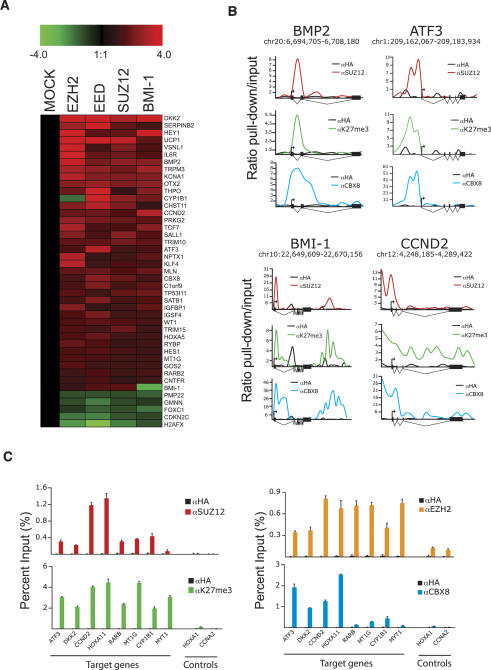
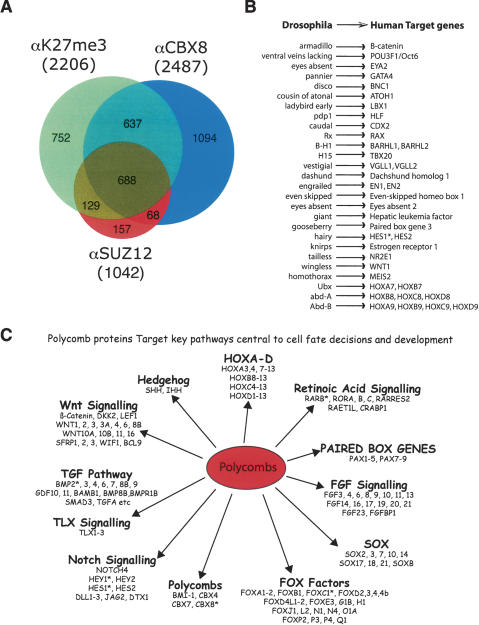
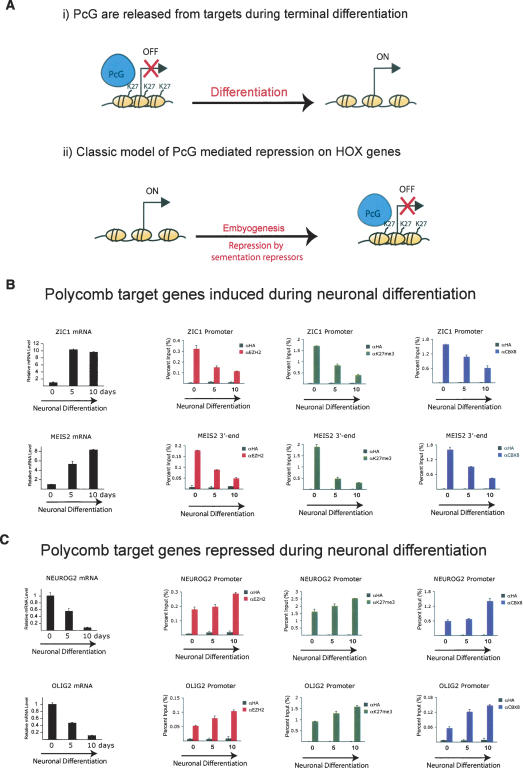
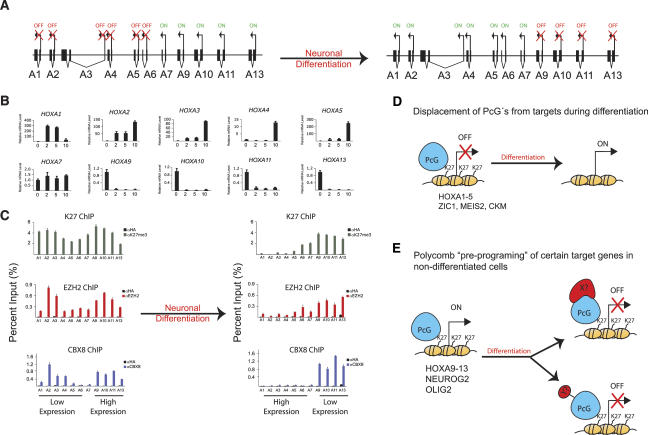
The Polycomb group (PcG) proteins form chromatin-modifying complexes that are essential for embryonic development and stem cell renewal and are commonly deregulated in cancer. Here, we identify their target genes using genome-wide location analysis in human embryonic fibroblasts. We find that Polycomb-Repressive Complex 1 (PRC1), PRC2, and tri-methylated histone H3K27 co-occupy >1000 silenced genes with a strong functional bias for embryonic development and cell fate decisions. We functionally identify 40 genes derepressed in human embryonic fibroblasts depleted of the PRC2 components (EZH2, EED, SUZ12) and the PRC1 component, BMI-1. Interestingly, several markers of osteogenesis, adipogenesis, and chrondrogenesis are among these genes, consistent with the mesenchymal origin of fibroblasts. Using a neuronal model of differentiation, we delineate two different mechanisms for regulating PcG target genes. For genes activated during differentiation, PcGs are displaced. However, for genes repressed during differentiation, we paradoxically find that they are already bound by the PcGs in nondifferentiated cells despite being actively transcribed. Our results are consistent with the hypothesis that PcGs are part of a preprogrammed memory system established during embryogenesis marking certain key genes for repressive signals during subsequent developmental and differentiation processes.


Figures

Figure 1.
Figure 1.
Genome-wide expression screen to identify gene changes in Polycomb depleted cells. (A) Western blot analysis of lysates prepared from TIG3 fibroblasts 44 h after transfection with siRNA oligos designed to inhibit the expression of EZH2, EED, SUZ12, or BMI-1. Tubulin was used as a loading control. (B) Venn diagram depicting the overlap in genes increased >1.2-fold in PRC2 (EZH2, EED, and SUZ12 combined) and PRC1 (BMI-1) depletion. (C) Treeview representation of Affymetrix expression data depicting the gene expression changes in Polycomb-depleted cells. (D) Validation of gene expression changes by qPCR for a selection of genes (indicated in B). mRNA was prepared from TIG3 cells transfected with Mock (M), EZH2 (Z), EED (E), SUZ12 (S), or BMI-1 (B) siRNAs. The experiments were performed independently of the gene expression array experiments.
Figure 2.
Figure 2.
The PcG proteins and H3K27me3 are highly enriched on the HOXA gene cluster. (A) ChIP-on-chip tiling array analysis of the HOXA locus spanning 140 kb of DNA starting at position 26,880,000 on chromosome 7. High-resolution mapping of the 140 kb was achieved by representing 2840 probes of 50 bp with an average spacing of 3 bp between probes. The Y-axis represents the Log2 signal ratios (bound/input) for the indicated antibodies. The results of the promoter ChIP-on-chip experiment are also shown for the HOXA promoters. In this analysis, chips were used containing 24,275 human promoters from 1300 bp upstream to 200 bp downstream of TSS with 15 50-bp probes with an average spacing of 100 bp between probes. (C) Custom ChIP-on-chip data; (P) Promoter ChIP-on-chip data. (B) XY scatterplot representation of the data depicted in A, created by plotting the average enrichments at 5-kb intervals. (C) Normal ChIP analysis of the promoters of the HOXA gene cluster. Primers were designed within the promoter regions (indicated with red bars) of all HOXA genes as indicated at the top of the panel. Enrichment is shown as percentage input.
Figure 3.
Figure 3.
Identification of 43 PcG target genes whose expression changes in Polycomb-depleted cells. (A) Treeview depiction of the expression changes in Polycomb-depleted cells of 43 direct PcG target genes. (B) XY scatterplot representations of SUZ12, H3K27me3, and CBX8 enrichments along the gene loci of BMP2, ATF3, BMI-1, and CCND2. The chromosome number and the region covered are depicted above each panel. (C) Standard ChIP analysis of newly identified Polycomb target genes using the previously identified MYT1 target gene as a positive control. The CCNA2 and HOXA1 genes are presented as negative controls.
Figure 4.
Figure 4.
Genome-wide mapping of PcG target promoters. (A) Venn diagram depicts significant overlaps between the presence of SUZ12, CBX8, and H3K27me3 on promoters. (B) A remarkable conservation of Polycomb target genes through evolution from Drosophila to humans. Several confirmed or predicted Drosophila PcG target genes are shown in the left column. In our analysis we have identified their human homologs as being human PcG targets (see Supplementary Table 3). (C) A selection of PcG target genes identified in this study, focusing on those known to be involved in key pathways controlling development, differentiation, stem cell biology, and cell fate decisions.
Figure 5.
Figure 5.
PcGs bind to genes that are repressed or induced during neuronal differentiation. (A) Models for how PcGs could regulate gene expression during terminal differentiation. (B) qPCR and ChIP analysis of two PcG target genes (ZIC1 and MEIS2) induced during neuronal differentiation of NT2/D1 cells treated with 1 μM RA. (C) qPCR and ChIP analysis of two genes (NEUROG2 and OLIG2) repressed during neuronal differentiation of NT2/D1 cells treated with 1 μM RA.
Figure 6.
Figure 6.
Polycombs are present on active HOX genes in nondifferentiated cells. (A) Schematic depiction of the gene expression changes along the HOXA locus upon RA-mediated induction of neuronal differentiation. (B) Quantification of mRNA expression changes of HOXA genes during neuronal differentiation of NT2/D1 cells by qPCR. (C) ChIP analysis of EZH2, H3K27me3, and CBX8 binding to the promoters of the HOXA1 to HOXA13 genes both before and after 10 d of RA treatment. (D) Displacement of PcGs from target genes activated during differentiation, for example, ZIC1, MEIS2, RARB, and HOXA1–5 in neuronal differentiation and CKM in myoblast differentiation. (E) Polycomb “preprogramming” of certain target genes in undifferentiated cells, for example, NEUROG2, OLIG2, and HOXA9–13. These genes are paradoxically expressed while being bound by PcGs in undifferentiated cells. Several hypothetical mechanisms for the triggering of PcG repressive function during differentiation are possible, include post-translational modifications of the PcGs, addition of H1K26me3 or ubiquitinated H2A-K119 marks, recruitment of DNA methyltransferases, the binding of additional transcriptional repressors, or a combination of these mechanisms.

References

    1. Al-Awqati Q. Terminal differentiation of intercalated cells: The role of hensin. Annu. Rev. Physiol. 2003;65:567–583. - PubMed
    1. Bloyer S., Cavalli G., Brock H.W., Dura J.M. Identification and characterization of polyhomeotic PREs and TREs. Dev. Biol. 2003;261:426–442. - PubMed
    1. Bracken A.P., Pasini D., Capra M., Prosperini E., Colli E., Helin K. EZH2 is downstream of the pRB–E2F pathway, essential for proliferation and amplified in cancer. EMBO J. 2003;22:5323–5335. - PMC - PubMed
    1. Cao R., Zhang Y. The functions of E(Z)/EZH2-mediated methylation of lysine 27 in histone H3. Curr. Opin. Genet. Dev. 2004;14:155–164. - PubMed
    1. Cao R., Tsukada Y., Zhang Y. Role of Bmi-1 and Ring1A in H2A ubiquitylation and Hox gene silencing. Mol. Cell. 2005;20:845–854. - PubMed

Publication types

MeSH terms