

Toward understanding the genetics of alcohol drinking through transcriptome meta-analysis
- PMID: 16618939
- PMCID: PMC1458884
- DOI: 10.1073/pnas.0510188103
Toward understanding the genetics of alcohol drinking through transcriptome meta-analysis
Abstract
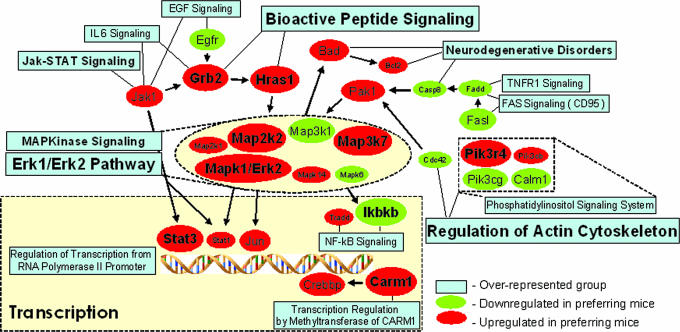
Much evidence from studies in humans and animals supports the hypothesis that alcohol addiction is a complex disease with both hereditary and environmental influences. Molecular determinants of excessive alcohol consumption are difficult to study in humans. However, several rodent models show a high or low degree of alcohol preference, which provides a unique opportunity to approach the molecular complexities underlying the genetic predisposition to drink alcohol. Microarray analyses of brain gene expression in three selected lines, and six isogenic strains of mice known to differ markedly in voluntary alcohol consumption provided >4.5 million data points for a meta-analysis. A total of 107 arrays were obtained and arranged into six experimental data sets, allowing the identification of 3,800 unique genes significantly and consistently changed between all models of high or low amounts of alcohol consumption. Several functional groups, including mitogen-activated protein kinase signaling and transcription regulation pathways, were found to be significantly overrepresented and may play an important role in establishing a high level of voluntary alcohol drinking in these mouse models. Data from the general meta-analysis was further filtered by a congenic strain microarray set, from which cis-regulated candidate genes for an alcohol preference quantitative trait locus on chromosome 9 were identified: Arhgef12, Carm1, Cryab, Cox5a, Dlat, Fxyd6, Limd1, Nicn1, Nmnat3, Pknox2, Rbp1, Sc5d, Scn4b, Tcf12, Vps11, and Zfp291 and four ESTs. The present study demonstrates the use of (i) a microarray meta-analysis to analyze a behavioral phenotype (in this case, alcohol preference) and (ii) a congenic strain for identification of cis regulation.
Conflict of interest statement
Conflict of interest statement: No conflicts declared.
Figures

References
-
- Crabbe J. C. Am. J. Med. Genet. 2002;114:969–974. - PubMed
-
- McClearn G., Wilson J., Meredith W. The Use of Isogenic and Heterogenic Mouse Stocks in Behavioral Research. New York: Appleton–Century–Crofts; 1970.
-
- Belknap J. K., Atkins A. L. Mamm. Genome. 2001;12:893–899. - PubMed
-
- Phillips T. J., Crabbe J. C., Metten P., Belknap J. K. Alcohol. Clin. Exp. Res. 1994;18:931–941. - PubMed
Publication types
MeSH terms
Substances
Grants and funding
- U01 AA013489/AA/NIAAA NIH HHS/United States
- AA013404/AA/NIAAA NIH HHS/United States
- AA013520/AA/NIAAA NIH HHS/United States
- U01 AA013520/AA/NIAAA NIH HHS/United States
- AA013518/AA/NIAAA NIH HHS/United States
- AA013182/AA/NIAAA NIH HHS/United States
- U01 AA013475/AA/NIAAA NIH HHS/United States
- AA006243/AA/NIAAA NIH HHS/United States
- U01 AA013518/AA/NIAAA NIH HHS/United States
- U01 AA013519/AA/NIAAA NIH HHS/United States
- R01 AA011034/AA/NIAAA NIH HHS/United States
- AA013519/AA/NIAAA NIH HHS/United States
- P60 AA010760/AA/NIAAA NIH HHS/United States
- R21 AA013182/AA/NIAAA NIH HHS/United States
- U01 AA013483/AA/NIAAA NIH HHS/United States
- AA013517/AA/NIAAA NIH HHS/United States
- P50 AA010760/AA/NIAAA NIH HHS/United States
- R01 AA006243/AA/NIAAA NIH HHS/United States
- U01 AA013517/AA/NIAAA NIH HHS/United States
- AA013475/AA/NIAAA NIH HHS/United States
- AA11034/AA/NIAAA NIH HHS/United States
- AA013489/AA/NIAAA NIH HHS/United States
- U01 AA013484/AA/NIAAA NIH HHS/United States
- K01 AA013403/AA/NIAAA NIH HHS/United States
- U24 AA013517/AA/NIAAA NIH HHS/United States
- AA013483/AA/NIAAA NIH HHS/United States
- AA010760/AA/NIAAA NIH HHS/United States
LinkOut - more resources
Full Text Sources
Medical
Molecular Biology Databases
Research Materials
