. 2006 May 3;25(9):1997-2006.
doi: 10.1038/sj.emboj.7601062. Epub 2006 Apr 13.

An aging pathway controls the TrkA to p75NTR receptor switch and amyloid beta-peptide generation

Affiliations

An aging pathway controls the TrkA to p75NTR receptor switch and amyloid beta-peptide generation

Claudio Costantini et al. EMBO J. .

Abstract

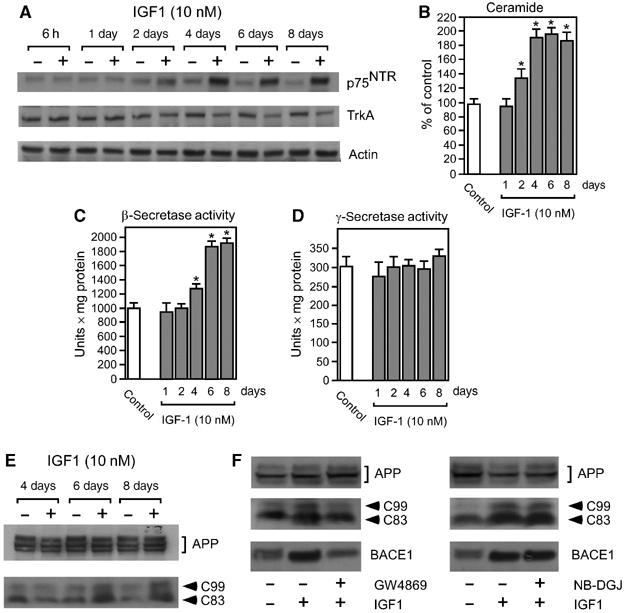
Aging of the brain is characterized by marked changes in the expression levels of the neurotrophin receptors, TrkA and p75(NTR). An expression pattern in which TrkA predominates in younger animals switches to one in which p75(NTR) predominates in older animals. This TrkA-to-p75(NTR) switch is accompanied by activation of the second messenger ceramide, stabilization of beta-site amyloid precursor protein-cleaving enzyme-1 (BACE1), and increased production of amyloid beta-peptide (Abeta). Here, we show that the insulin-like growth factor-1 receptor (IGF1-R), the common regulator of lifespan and age-related events in many different organisms, is responsible for the TrkA-to-p75(NTR) switch in both human neuroblastoma cell lines and primary neurons from mouse brain. The signaling pathway that controls the level of TrkA and p75(NTR) downstream of the IGF1-R requires IRS2, PIP3/Akt, and is under the control of PTEN and p44, the short isoform of p53. We also show that hyperactivation of IGF1-R signaling in p44 transgenic animals, which show an accelerated form of aging, is characterized by early TrkA-to-p75(NTR) switch and increased production of Abeta in the brain.


Figures

Figure 1
Figure 1
IGF1 regulates APP processing by acting upstream of p75NTR/TrkA in SH-SY5Y human neuroblastoma cell lines. (A–F) SH-SY5Y cells were treated with IGF1 in the absence of serum. (A) p75NTR and TrkA steady-state levels were assessed by immunoblotting of total cell lysates. (B) Endogenous ceramide was analyzed by TLC. Error bars represent the s.d. of four different assays. Asterisk indicates statistical significance from control (no treatment). (C, D) β- (C) and γ- (D) secretase activities from cell homogenates were analyzed in vitro by using the QTL lightspeed assay. Error bars represent the s.d. of four different assays. Asterisk indicates statistical significance from control (no treatment). (E) Western blot analysis of APP processing following IGF1 treatment. Mature and immature APP, together with C83 and C99, are indicated. (F) Treatment of SH-SY5Y cells with IGF1 was repeated in the presence or absence of either the nSMase inhibitor GW4869 (5 μM) or the ceramide-specific glucosyltransferase inhibitor NB-DGJ (50 μM).
Figure 2
Figure 2
The TrkA-to-p75NTR switch downstream of IGF1-R requires IRS2, PI3K, and the second messenger PIP3. (A) Western blot analysis of SH-SY5Y cells treated with IGF1 in the presence of LY294002 (LY; 10 μM) and/or PD98059 (PD; 20 μM). p75NTR and TrkA are indicated. (B) Western blot analysis of IRS1 and IRS2 expression levels in SH-SY5Y and SHEP neuroblastoma cells in the absence of IGF1 treatment. Akt phosphorylation and p75NTR steady-state levels were analyzed both before and after IGF1 treatment. (C) Western blot analysis of PTEN, IRS2, and p75NTR in SHEP neuroblastoma cells prior and after transfection with human IRS2 and PTEN. (D, E) SH-SY5Y cells were treated with IGF1 before and after silencing of IRS2. siRNA against Irs2 contained a pool of several siRNA duplexes targeted against Irs2. Treatment was started the day before incubation with IGF1 and was repeated 3 days later. (D) Western blot analysis of IRS2, p75NTR, and APP. (E) β-Secretase activity from cell homogenates was analyzed in vitro by using the QTL lightspeed assay. Asterisk indicates statistical significance.
Figure 3
Figure 3
IGF1-R acts upstream of p75NTR/TrkA during neuronal life in culture. (A–E) Primary neurons from wild-type (WT) mice were maintained in serum-free media up to 24 days. (A) Western blot analysis of IGF1-R, p75NTR, and TrkA expression levels at different time points. (B) Endogenous ceramide was analyzed by TLC following pre-labeling with [3H]palmitic acid during days 0–3 of culture. Error bars represent the s.d. of four different assays. Asterisks indicate statistical significance from day 3 (*) or age-matched (#) controls. Manumycin A (Man A) was added in the media 3 days before the time-point indicated in the figure, and used at the final concentration of 100 μM. (C) Aβ levels in the conditioned media were determined by standard sandwich ELISA using an antirodent Aβ antibody. Error bars represent the s.d. of six different determinations. (D, E) Western blot analysis of neurons treated with either siRNA duplexes or antisense oligonucleotides designed against Igf1-r. siRNA and antisense strategies were used with day 18 and 24 neurons because they showed the highest levels of IGF1-R activation (A). (D) siRNA against Igf1-r contained a pool of several siRNA duplexes targeted against Igf1-r. Treatment was carried out once at day 15 (for experiments performed at day 18) or day 21 (for experiments performed at day 24). (E) The effects produced by the antisense were compared to an Igf1-r sense oligonucleotide. Both oligos were used at 10 μM final concentration. Treatment was started 6 days before the experiment and the oligos were added every three days together with fresh media. (F) Neurons from WT and p44+/+ mice were prepared as in (A) and then analyzed by immunoblotting. (G) Cerebral cortex from 3 and 30-month-old WT mice fed either a control or a restricted diet was analyzed for IGF1-R expression. Western blot of three different animals for each group is shown.
Figure 4
Figure 4
p44+/+ mice show an early and dramatic activation of p75NTR expression and APP/Aβ metabolism. (A) Analysis of cerebral cortex from wild type (WT) and p44+/+ mice. The steady-state levels of p75NTR, TrkA, BACE1, and C99 were analyzed by Western blot with the appropriate antibodies. Ceramide was quantified by both ESI-MS and TLC, whereas Aβ levels were determined by standard sandwich ELISA using an antirodent Aβ antibody. The average values of endogenous Aβtotal obtained for 1-month-old animals were 6.4±0.9 pmol/mg and are in the same range of previously found values for endogenous Aβtotal using murine-specific reporter antibodies (Bowen et al, 2004; Costantini et al, 2005). Results are expressed as percent of 1-month-old WT mice. Error bars represent the s.d. of 12 different determinations. Asterisk indicates a significant difference from 1-month-old animals (*) or age-matched controls (#). (B) 9-month-old p44+/+ mice were treated with manumycin A for 1 month (3.5 mg per animal over a period of 1 month) and then analyzed at the end of treatment as described in (A). Results are expressed as in (A). Error bars represent the s.d. of 12 different determinations. Asterisk indicates a significant difference from untreated animals (*). (CD) Primary neurons (day 6 in culture) from WT and p44+/+ mice were prepared as described in Figure 3. (C) Western blot of cell lysates was performed with the indicated antibodies. (D) β-Secretase activity from cell homogenates was analyzed in vitro by using the QTL lightspeed assay. Error bars represent the s.d. of four different assays. Asterisks indicate statistical significance from WT (nontransgenic) neurons (*) and from p44+/+ neurons in the absence of treatment (#).
Figure 5
Figure 5
A model of the molecular pathways controlling Aβ generation during aging. Genetic and pharmacological manipulations described in the text are indicated in red or blue next to the steps in the pathway that they affect. Manipulations indicated in red inhibit signaling, while the blue manipulation amplifies signaling.

References

    1. Bondy CA, Cheng CM (2004) Signaling by insulin-like growth factor 1 in brain. Eur J Pharmacol 490: 25–31 - PubMed
    1. Bowen RL, Verdile G, Liu T, Parlow AF, Perry G, Smith MA, Martins RN, Atwood CS (2004) Luteinizing hormone, a reproductive regulator that modulates the processing of amyloid-beta precursor protein and amyloid-beta deposition. J Biol Chem 279: 20539–20545 - PubMed
    1. Campisi J (2004) Fragile fugue: p53 in aging, cancer and IGF signaling. Nat Med 10: 231–232 - PubMed
    1. Carro E, Spuch C, Trejo JL, Antequera D, Torres-Aleman I (2005a) Choroid plexus megalin is involved in neuroprotection by serum insulin-like growth factor I. J Neurosci 25: 10884–10893 - PMC - PubMed
    1. Carro E, Torres-Aleman I (2004) The role of insulin and insulin-like growth factor I in the molecular and cellular mechanisms underlying the pathology of Alzheimer's disease. Eur J Pharmacol 490: 127–133 - PubMed

Publication types

MeSH terms

LinkOut - more resources