

Core temperature and percentage of dehydration in professional football linemen and backs during preseason practices
- PMID: 16619090
- PMCID: PMC1421487
Core temperature and percentage of dehydration in professional football linemen and backs during preseason practices
Abstract
Context: Thermal responses of average-sized male subjects (mass of approximately 70 kg) may not accurately reflect the rate of heat storage in larger athletes with greater muscle mass.
Objective: To determine if core temperature (T(c)) is different in National Football League linemen and backs and if T(c) is related to percentage of dehydration or sweat rate.
Design: We measured T(c) and sweat rate in professional football players during preseason twice-daily practices.
Setting: Preseason training camp.
Patients or other participants: Eight linemen (age = 26.6 +/- 2.1 years, height = 191.8 +/- 4.5 cm, mass = 134.8 +/- 10.7 kg, body surface area = 2.61 +/- 0.12 m2) and 6 backs (age = 27.0 +/- 4.2 years, height = 185.0 +/- 6.3 cm, mass = 95.6 +/- 11.1 kg, body surface area = 2.19 +/- 0.16 m2).
Main outcome measure(s): We measured T(c) using ingestible sensors. Resting T(c) was recorded in the mornings of data collection with players dressed in shorts and then every 15 minutes during 2-hour practices in full pads or shells. Mass was recorded before and after practices for determining the percentage of dehydration. In 8 of the 14 subjects (4 linemen, 4 backs), sweat rate was calculated using the change in mass adjusted for fluid intake and urine production.
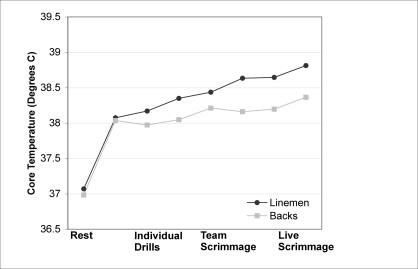
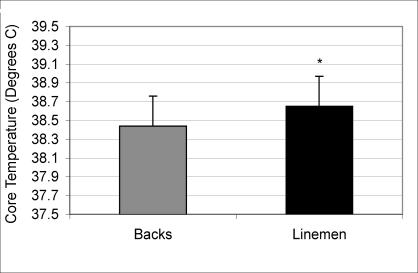
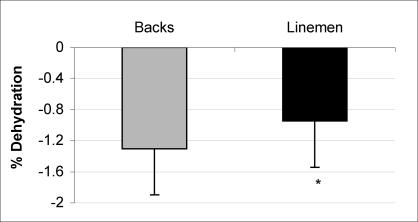
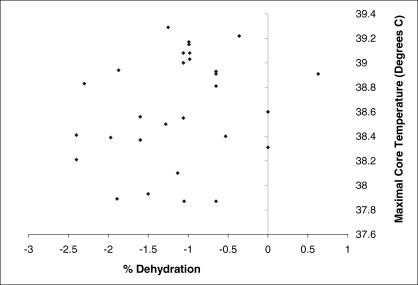
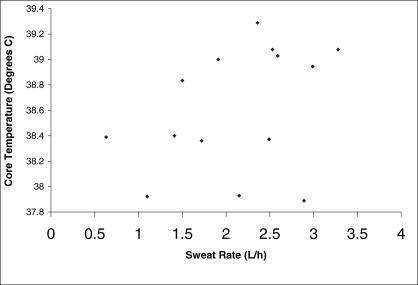
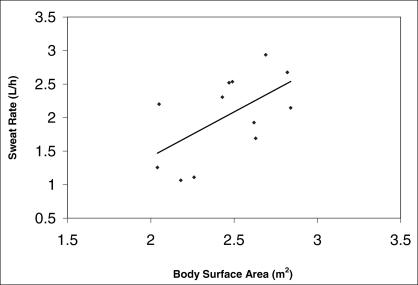
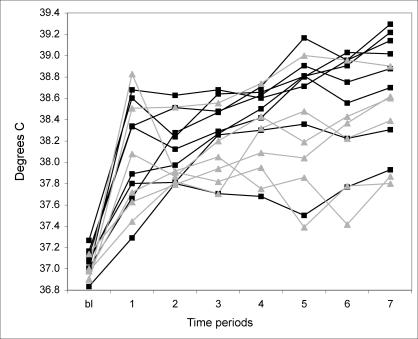
Results: Height, mass, and body surface area were greater in linemen than in backs. We noted a linear trend over time for T(c) in both groups. Maximal T(c) was higher in linemen (38.65 +/- 0.48 degrees C) than in backs (38.44 +/- 0.32 degrees C), but linemen were less dehydrated than backs (-0.94 +/- 0.6% versus -1.3 +/- 0.7%). Sweat rate was 2.11 +/- 0.77 L/h and correlated significantly with body surface area (r = 0.77, P < .05). Maximal T(c) was not correlated with either percentage of dehydration or sweat rate.
Conclusions: Maximal T(c) was not associated with percentage of dehydration or sweat rate. Linemen were less dehydrated but demonstrated higher T(c) than backs during practice. Maximal T(c) was generally achieved during live scrimmaging.
Figures
References
-
- Mueller FO. Catastrophic sports injuries: who is at risk? Curr Sports Med Rep. 2003;2:57–58. - PubMed
-
- Broad EM, Burke LM, Cox GR, Heeley P, Riley M. Body weight changes and voluntary fluid intakes during training and competition sessions in team sports. Int J Sport Nutr. 1996;6:307–320. - PubMed
-
- Millard-Stafford M, Sparling PB, Rosskopf LB, Snow TK, DiCarlo LJ, Hinson BT. Fluid intake in male and female runners during a 40-km run in the heat. J Sports Sci. 1995;13:257–263. - PubMed
LinkOut - more resources
Full Text Sources
Other Literature Sources