. 2006 Jul;63(7):395-414.
doi: 10.1002/cm.20131.

Arp2/3 complex-mediated actin polymerisation occurs on specific pre-existing networks in cells and requires spatial restriction to sustain functional lamellipod extension

Affiliations

Arp2/3 complex-mediated actin polymerisation occurs on specific pre-existing networks in cells and requires spatial restriction to sustain functional lamellipod extension

D Shao et al. Cell Motil Cytoskeleton. 2006 Jul.

Abstract

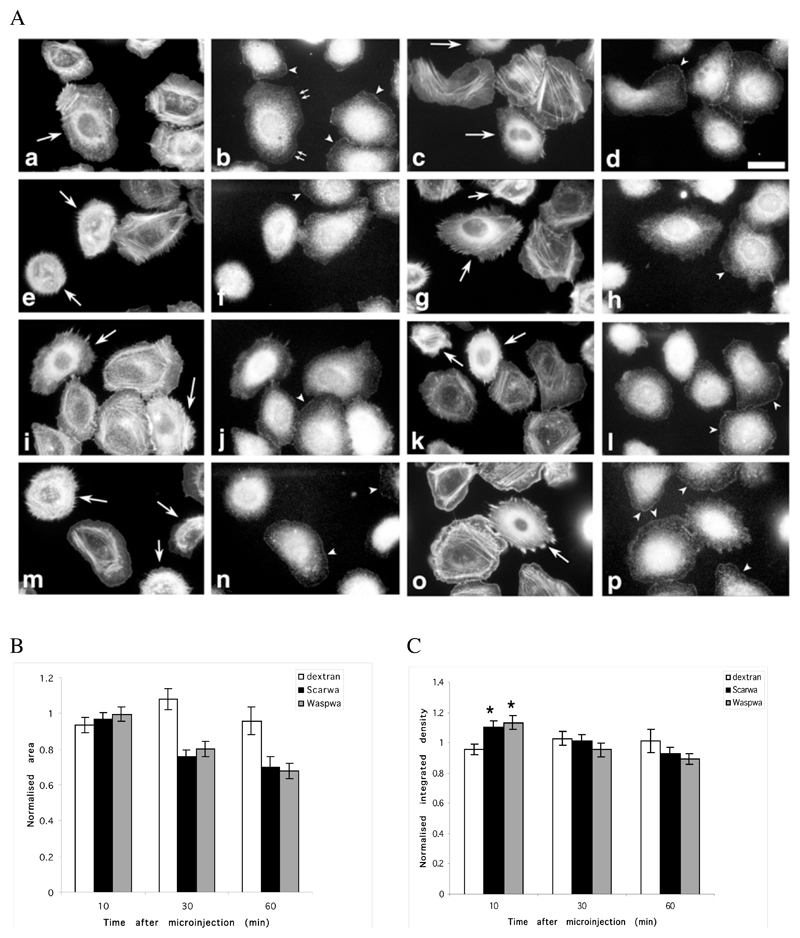
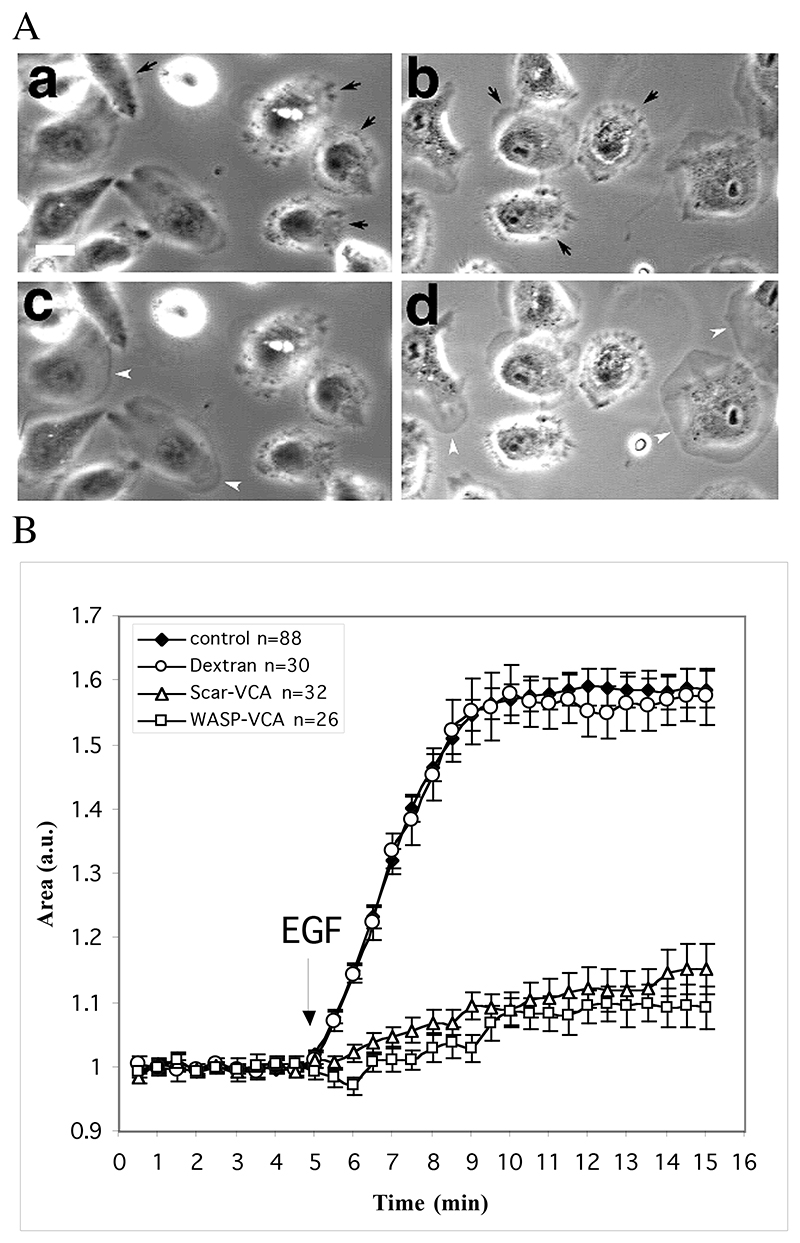
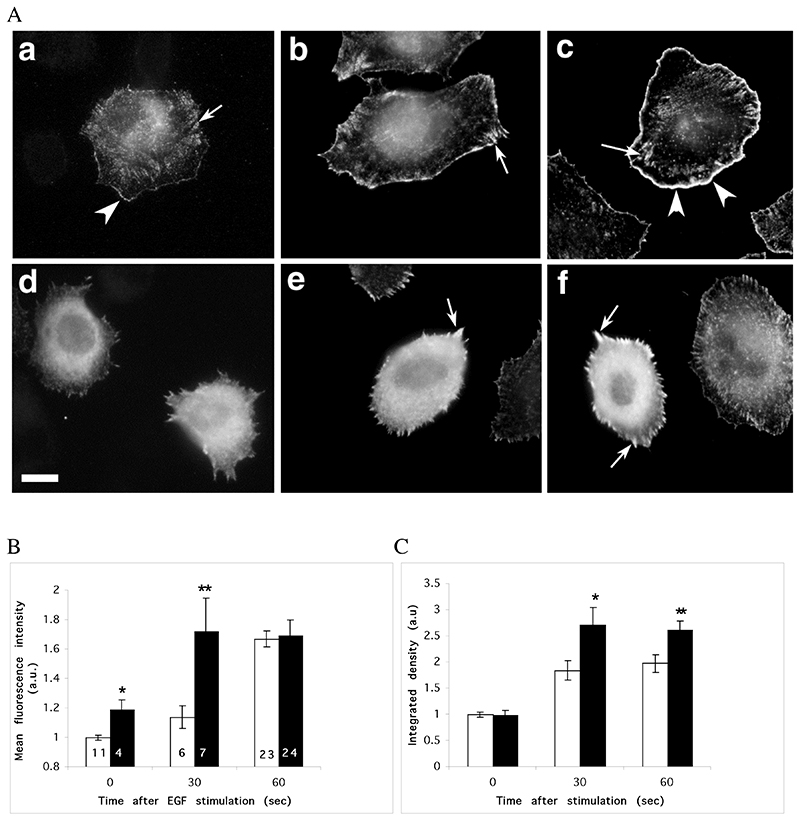
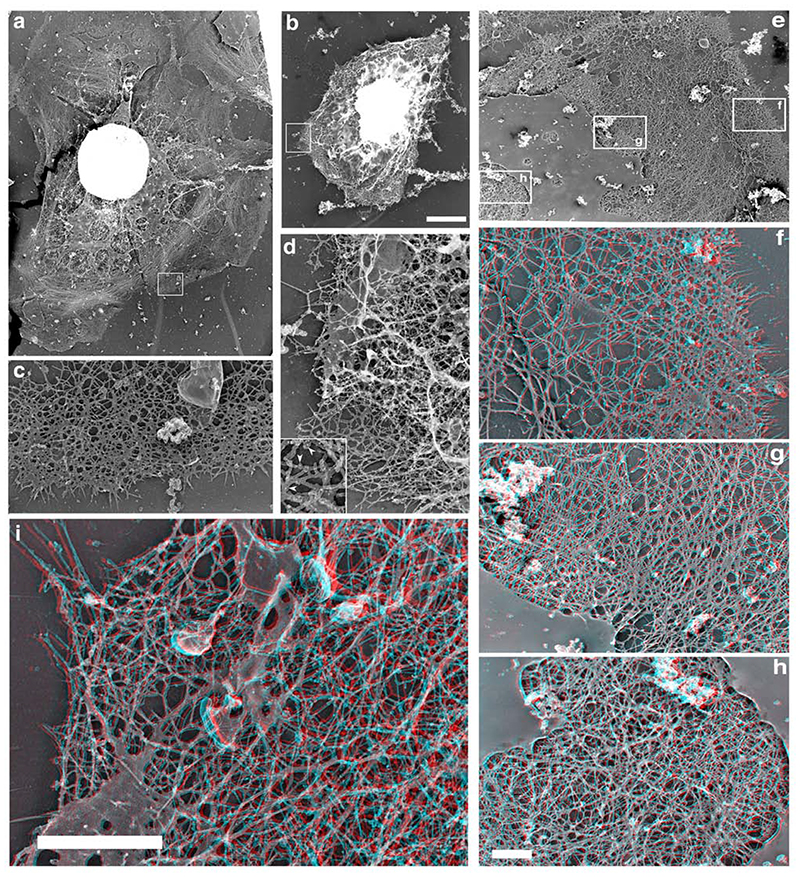
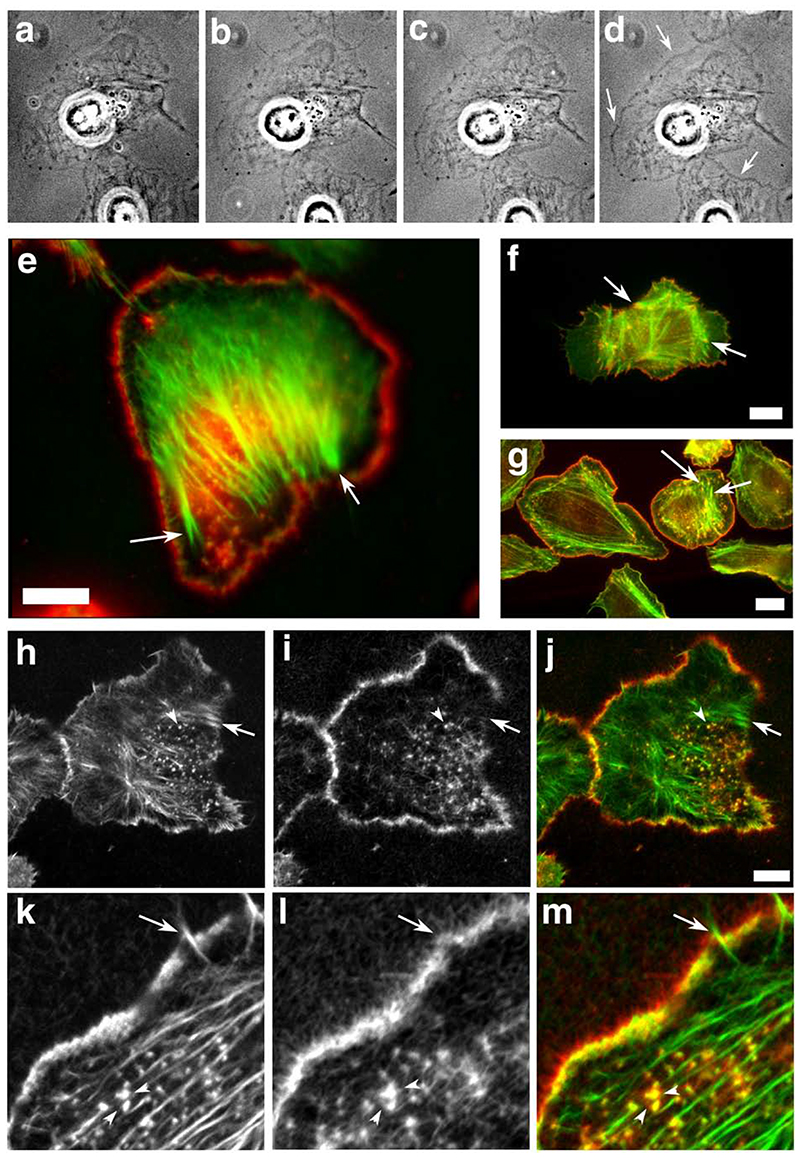
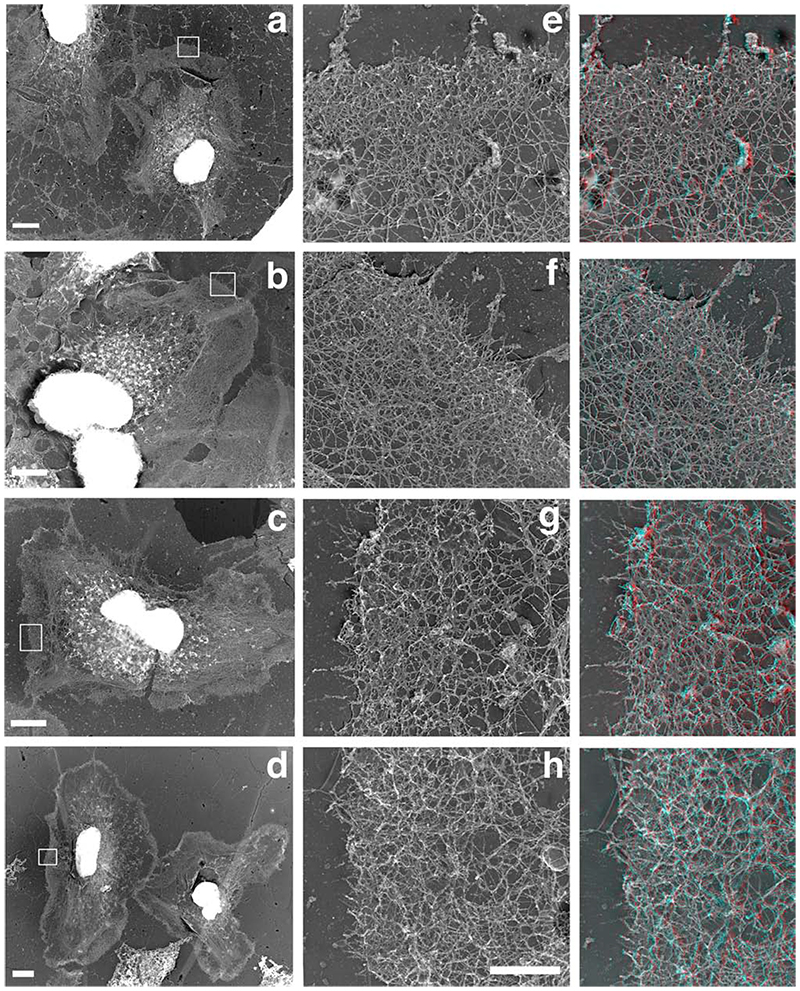
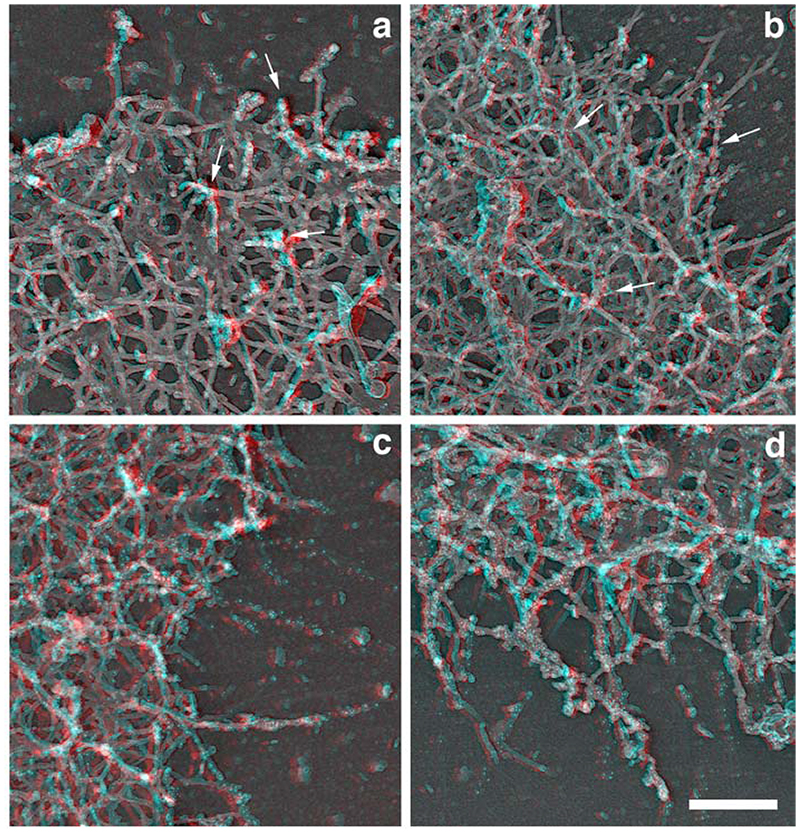
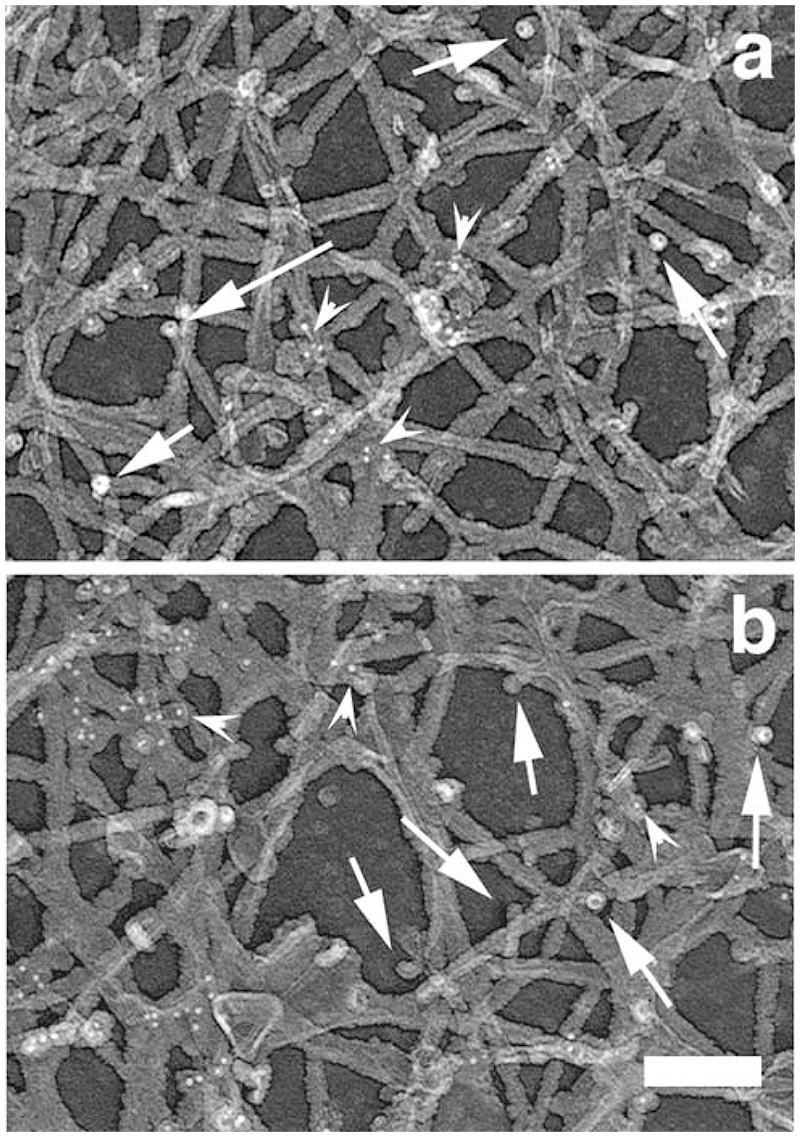
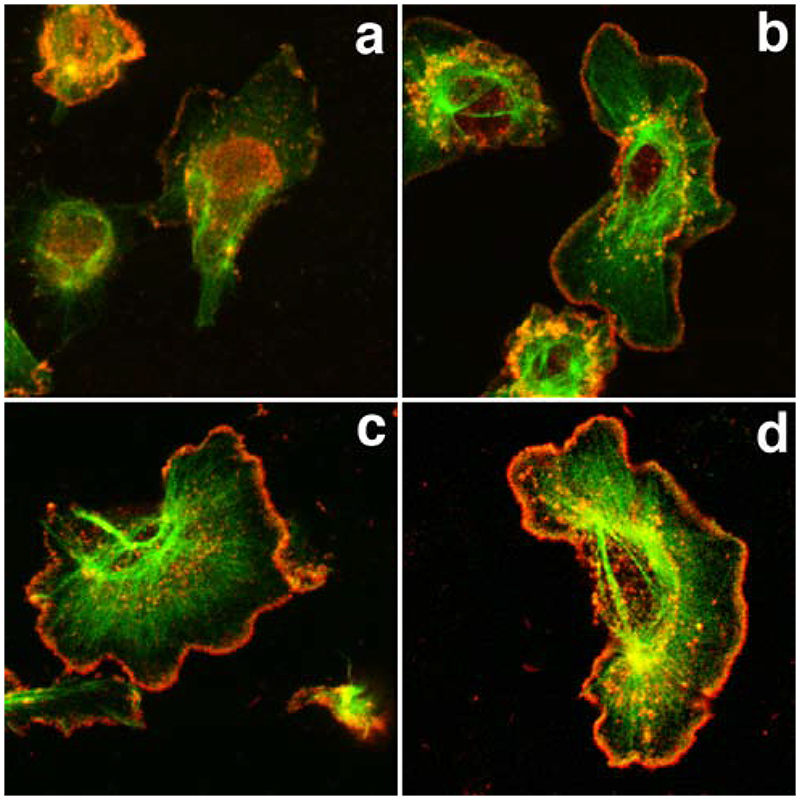
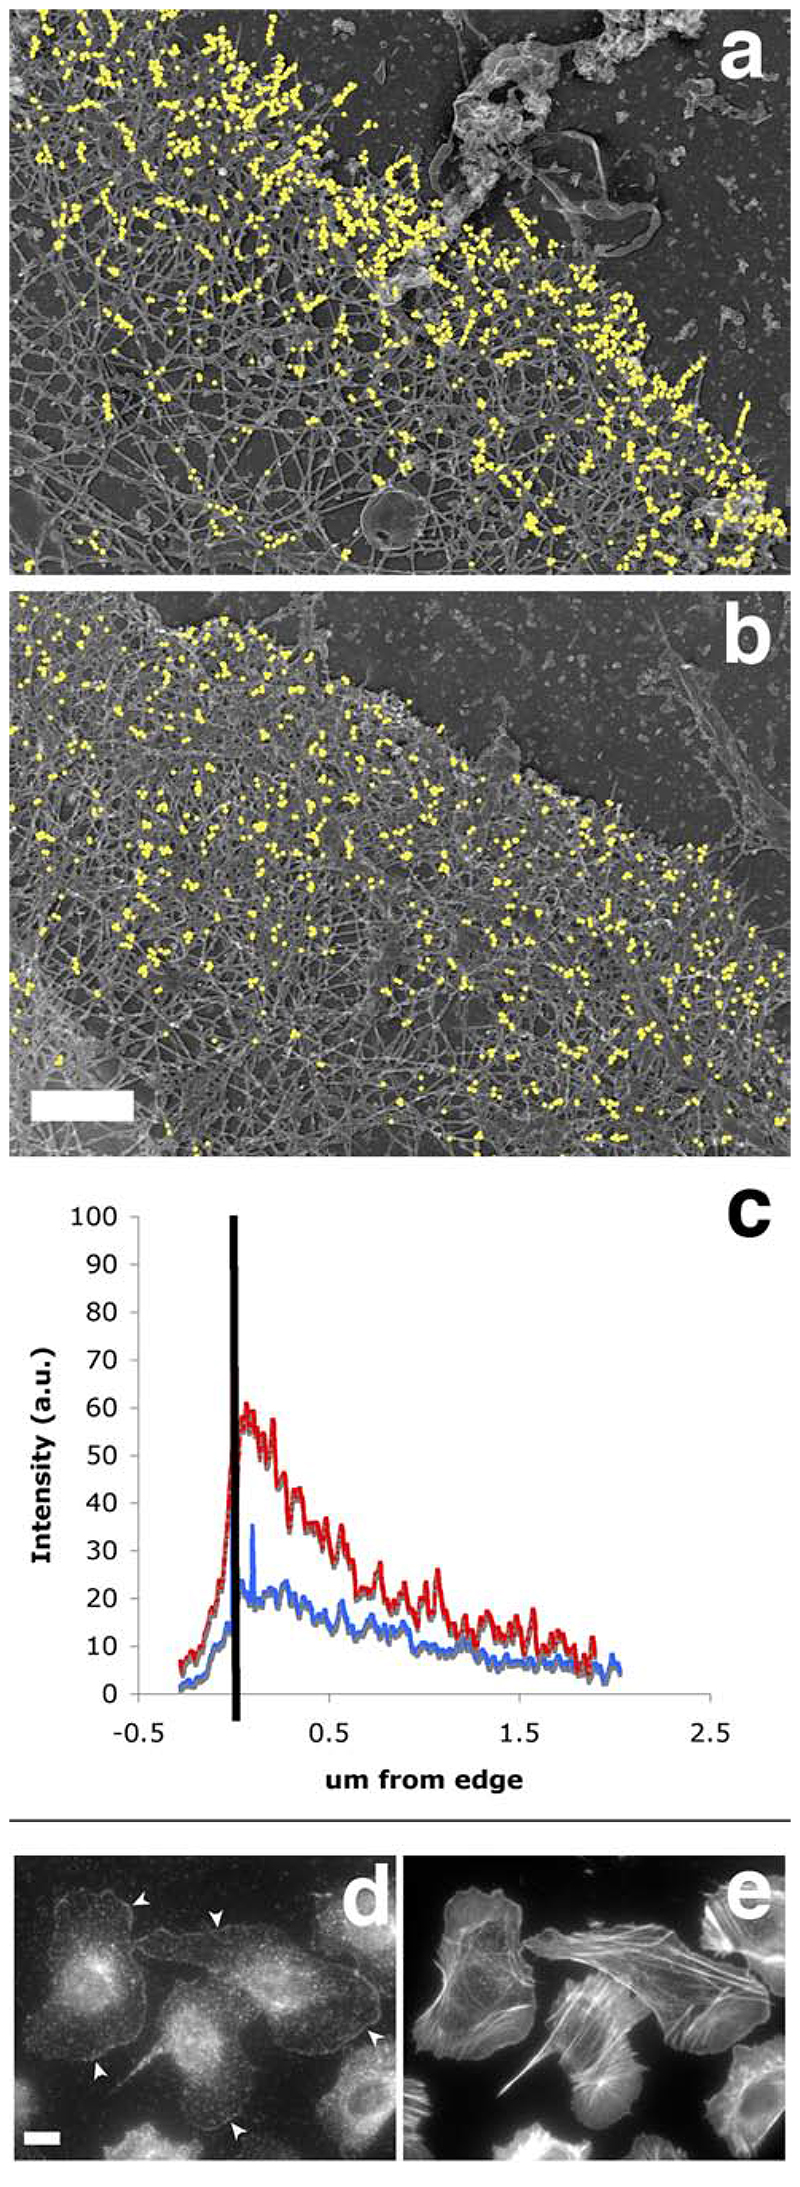
The classical Arp2/3-mediated dendritic network defines the cytoskeleton at the leading edge of crawling cells, and it is generally assumed that Arp2/3-mediated actin polymerization generates the force necessary to extend lamellipods. Our previous work suggested that successful lamellipod extension required not only free barbed ends for actin polymerization but also a proper ultrastructural organization of the cytoskeleton. To further explore the structural role of the Arp2/3 complex-mediated networks in lamellipod morphology and function, we performed a detailed analysis of the ultrastructure of the Arp2/3-mediated networks, using the WA domains of Scar and WASp to generate mislocalised Arp2/3 networks in vivo, and to reconstruct de novo Arp2/3-mediated actin nucleation and polymerization on extracted cytoskeletons. We present here evidence that spatially unrestricted Arp2/3-mediated networks are intrinsically three-dimensional and multilayered by nature and, as such, cannot sustain significant polarized extension. Furthermore, such networks polymerize only at preferred locations in extracted cells, corresponding to pre-existing Arp2/3 networks, suggesting that the specific molecular organization of the actin cytoskeleton, in terms of structure and/or biochemical composition, dictates the location of Arp2/3 complex-mediated actin polymerization. We propose that successful lamellipod extension depends not only on localized actin polymerization mediated through local signalling, but also on spatial restriction of the Arp2/3 complex-mediated nucleation of actin polymerization, both in terms of location within the cell and ultrastructural organization of the resulting network.


Figures

Figure 1
Figure 1
Microinjection of WA domains causes a rapid reorganization of the actin cytoskeleton and alters Arp2/3 location in resting and stimulated cells. MTLn3 cells were microinjected with a WASP-WA or Scar-WA peptide/dextran mix or with dextran alone, and fixed and stained for F-actin (phalloidin) and Arp2/3 (p34 antibodies) at different times after injection (a-d, 10 min; e-h, 30 min; i-l, 60 min after injection), or after stimulation with 5 nM EGF for 3 min 30 min after injection (m-p). A. F-actin (1 and 3rd column) and Arp2/3 (2nd and 4th column) distribution patterns: cells microinjected with the WA domains (WASP-WA peptide, left 2 columns; Scar-WA peptide, right 2 columns) accumulate F-actin in perinuclear region, while Arp2/3 is depleted from leading edges, even in stimulated cells. Arrows, injected cells; arrowheads, Arp2/3 complex at the leading edge; small double arrows, Arp2/3 complex at the leading edge in an injected cell where actin has already accumulated in the perinuclear region. Scale bar: 20μm. B. Quantification of cell area: the cell area was normalized to the area of control non-injected cells. WA-injected cells display significantly smaller area (P<0.001) than control cells. C. Quantification of total F-actin in microinjected cells: the integrated density value for the phalloidin fluorescence was used as a measure of total F-actin content in the cells, normalized to the levels in control non injected cells. An average of 30 cells (13-54) was measured for each time point. Both WASP-WA and Scar-WA injected cells display a significant increase in F-actin content 10 minutes after injection (* P<0.001 and P<0.005 respectively for Scar-WA and WASP-WA).
Figure 2
Figure 2
Microinjection of the WA domains inhibits EGF stimulated lamellipod extension. MTln3 cells were starved for 3 hours and microinjected with WA-domains 30 minutes prior to stimulation with 5 nM EGF. Phase contrast images were recorded every minutes using an OpenLab driven CCD camera and the resulting movies were processed for cell area measurements as described in Material and Methods A. Phase contrast images of injected cells before (a,b) and after (c,d) stimulation with EGF for 3 min. EGF stimulation triggers broad lamellipod extension in control cells (white arrow heads) but not in WASp-WA (a,c)- or Scar-WA (b,d)-domain injected cells (black arrows). Bar =20μm. B. Quantification of area change as a readout of EGF stimulated lamellipod extension. Arrow indicates time point when EGF was added.
Figure 3
Figure 3
Microinjection of Scar-WA domain triggers a complete reorganisation of barbed ends in resting cells, but does not prevent a further increase in barbed ends following EGF stimulation. MTLn3 cells were starved for 3 hours and microinjected with Scar-WA domain 30 minutes prior to barbed end labelling. Barbed ends were visualised by permeabilising the cells in presence of 0.45 uM labelled monomeric actin, and quantified as detailed in Material and Methods. A. Barbed ends staining before (a, d) and 30 sec (b, e) or 1 min (c, f) after EGF stimulation. In resting cells (a), barbed ends are localised at the edge of existing lamellipods (arrowheads), in focal contacts (arrows) and in a perinuclear diffuse pattern. Stimulation with EGF triggers a large increase in barbed ends specifically at the leading edge (arrowheads). Cells injected with Scar-WA domain display a diffuse and strong cytosplamic barbed end pattern (d), with an enrichment at focal contacts (arrows) after stimulation but not at the leading edge (e, f). Scale bar =10μm. B, C. Quantification of barbed ends at the leading edge (B) and total barbed ends in the cells (C). The barbed ends were measured locally as the mean fluorescence within 1.1 um at the leading edge (B), or globally as the integrated density of the fluorescence over the total cell area (C). Both numbers were normalised to control uninjected cells within the Scar-WA unstimulated sample (EGF 0). White bars, control cells; black bars, Scar-WA injected cells. The numbers in bar represents the number of cells analysed. Stars: significantly different from control (*, P<0.05; **, P<0.01).
Figure 4
Figure 4
Scar microinjection alters both the structure and the depth of the actin network at the leading edge. Resting MTLn3 cells were microinjected with Scar-WA domain and processed for rapid freeze/freeze dry and rotary shadowing to generate metal replicas. 3 dimensional red/blue views of the cytoskeleton were reconstructed from stereo pairs (f-i; proper viewing of these images require red/blue 3D glasses). a, c, e-h: control cells; b, d, i: Scar-WA injected cells. Control resting cells display broad lamellipods (a) with a typical dendritic-like network at the leading edge (c). The leading edge network is mostly a 2 dimensional array of filaments with a few filaments pointing upwards (e, f). After a relatively less dense of actin filaments, the network further inside becomes profoundly denser, mostly by building different layers in depth (g). The perinuclear actin network is extremely dense and multilayered (h). Scar-WA injected cells display a complete reorganisation of the actin network at the periphery (b, d, i). These cells fail to display any typical dendritic network at the periphery (d), but show a poorly organised dense network of actin, which is a multilayered 3D structure,, (i) similar to that normally found in the perinuclear region of resting cells (d). Inset, enlargement showing the 5 nm gold label on the filaments that allowed for identification of the microinjected cells (see Material and methods). Bars: a-d: bar= 2 um (a, b) and 0.5 um (c, d); e-h: bar= 2um (e) and 0.5 um (f-h); i: bar =1 um
Figure 5
Figure 5
Scar-WA-activated, -Arp2/3-mediated actin polymerisation in permeabilised resting cells using purified proteins results in a leading edge nucleation pattern similar to that of EGF-stimulated cells. Resting MTln3 cells were membrane-extracted and the resulting cytoskeletons were incubated with an Arp2/3 polymerisation mix (2 uM biotinylated actin, 5 nM Arp2/3, 20 nM Scar-WA, 0.2 uM cofilin) for 5-10 minutes. The samples were imaged live using fluorescence contrast (a-d), and/or fixed and processed for light (e) or confocal (h-m) microscopy. WA domain-activated Arp2/3 complex preferentially induces actin polymerisation at the leading edge in permeabilized cells in a pattern similar to barbed end generation after EGF stimulation. a-d: time course of the actin mix polymerisation in permeabilised cells as visualised by phase contrast microscopy. Actin accumulation around the cell circumference is visible as a denser grey outline of the cell (arrows). a, 40 sec after the beginning of membrane extraction, immediately before polymerisation mix addition; b-d, 1, 3 and 8 min after mix addition. e, h-m: analysis of the distribution of the de-novo Arp2/3 mediated network (green and h, k: pre-existing filaments as identified by phalloidin staining; red and i, l, newly polymerised network as identified using Cy3 coupled anti-biotin antibodies). k-m shows a detail of the leading edge of a cell after polymerisation of the mix. For comparison, light microscopy images of standard nucleation activity using monomeric actin polymerisation (standard barbed end distribution as in Figure 3; green, F-actin, red, newly polymerised actin) is shown for resting (f) and EGF-stimulated cells (g). Arrows point to focal contacts that show standard nucleation activity in both resting and stimulated cells, but are devoid of newly polymerised Arp2/3 mediated network. Arrowheads points at actin-rich dots inside the cell which show both standard actin nucleation and Arp2/3-mediated nucleation activity. Bars, 10 um.
Figure 6
Figure 6
The Arp2/3-mediated in situ polymerisation is concentrated as a 3 dimensional network in a circumferential pattern at the edge of the cells. A polymerisation mix containing actin (“actin only”, a, c) or actin plus Arp2/3 plus VCA (“actin + activated Arp2/3”, b, d) was incubated on extracted cytoskeleton for 1 (a, b) or 5 (c, d) min before the cells were fixed and processed for replica microscopy. Right column: Red/blue 3D version of images e-h. Note that the “actin + activated Arp2/3” samples present leading edges with a much denser actin network, which is largely the result of a strong 3 dimensional growth of a newly formed network on top of the pre-existing one (see 3D montages on the right). Bars: a-d, 5um; e-h, 1 um.
Figure 7
Figure 7
Structural organization of the de novo polymerised network in permeabilized cells. A polymerisation mix containing actin (“actin only”, a, c) or actin plus Arp2/3 plus VCA (“actin + activated Arp2/3”, b, d) was incubated on extracted cytoskeleton for 1 (a, b) or 5 (c, d) min before the cells were fixed and processed for replica microscopy. Newly polymerised labelled actin filaments (arrows pointing to gold particles) can be seen emerging from a largely unlabeled network, especially after a short time polymerisation (a, b), and with a greater density in the “actin + activated Arp2/3” sample (b). After 5 min polymerisation, a very dense 3 dimensional highly branched and strongly labelled network has been built at the edge of the cells, particularly in the “actin + activated Arp2/3” sample (d). Bar, 250 um.
Figure 8
Figure 8. The Arp2/3-mediated in situ polymerisation is minimal further back from the edge even after 5 min.
A polymerisation mix containing actin plus Arp2/3 plus VCA (“actin + activated Arp2/3”) was incubated on extracted cytoskeleton for 1 (a) or 5 (c) min before the cells were fixed and processed for replica microscopy. Arrowheads pointing at gold particles illustrate the minimal incorporation of exogenous actin, even after 5 min polymerisation (b). Arrows point at typical unlabelled free-end filaments. Bar, 100 nm.
Figure 9
Figure 9
The Arp2/3-mediated in situ polymerisation pattern partially matches the barbed end pattern both spatially and temporally. MTln3 cells, starved (a,c) or stimulated with EGF for 1 min (b,d) were permeabilised with triton and stained for barbed end distribution (a,b) or Arp2/3-mediated in situ polymerisation (c,d). The barbed end distribution was assessed after 1 min incorporation of biotin labelled actin in standard polymerisation-enabling buffer, while the Arp2/3-mediated in situ polymerisation pattern was revealed after 5 min incubation of an actin/Arp2/3/VCA polymerisation mix. The Arp2/3-mediated in situ polymerisation pattern was similar in resting and stimulated cells and matched the barbed end distribution in stimulated cells. Exogenous actin accumulation around the cell circumference also appeared increased in stimulated cells as opposed to starved cells.
Figure 10
Figure 10
The Arp2/3-mediated in situ polymerisation pattern is distinct from the free barbed end distribution, and closely matches the distribution of the cytoskeletal-bound fraction of the ar2/3 complex. A polymerisation mix containing actin (“actin only”, a, c) or actin plus Arp2/3 plus VCA (“actin + activated Arp2/3”, b, c) was incubated on extracted cytoskeleton for 1 min before the cells were fixed and processed for replica microscopy. Photos of the leading edges were taken at high resolution and these were processed to analyse the distribution of incorporated labelled actin as described in Material and Methods. a and b show the exogenous actin incorporation in representative leading edges from an “actin only “ sample and an “actin+ activated Arp2/3” sample respectively, where gold particles have been digitally enhanced for easier visualisation (bar, 0.5 um). c: average distribution of gold particles at the leading edge of the cells. Black bar represents the position of the leading edge, with the area on the left being outside the cell. Red, average distribution of exogenous actin in 6 “actin only “ samples; blue, average distribution of exogenous actin in 16 “actin+ activated Arp2/3” samples. d: the cytoskeleton–bound pool of Arp2/3 complex is mostly at the leading edge, mimicking the nucleation pattern in cells. Resting MTLn3 cells were extracted for 1 minute with 0.1% of Triton in cytoskeletal buffer containing 1 ug/ml phallacidin, and fixed and stained for F-actin using labelled phalloidin (right) and for Arp2/3 complex using anti-p34 antibodies (left). Detergent extraction of live cells eliminates most of the Arp2/3 complex in cytoplasm whilst a large portion of the Arp2/3 complex at the leading edge remains intact (arrowheads). Bar. 10 um.

Similar articles

Cited by

References

    1. Anderson SI, Behrendt B, Machesky LM, Insall RH, Nash GB. Linked regulation of motility and integrin function in activated migrating neutrophils revealed by interference in remodelling of the cytoskeleton. Cell Motil Cytoskeleton. 2003;54:135–46. - PubMed
    1. Atilgan E, Wirtz D, Sun S. Morphology of the Lamellipodium and Organization of Actin Filaments at the Leading Edge of Crawling Cells. Biophys J. 2005;89:3589–602. - PMC - PubMed
    1. Bailly M, Ichetovkin I, Grant W, Zebda N, Machesky LM, Segall JE, Condeelis J. The F-actin side binding activity of the Arp2/3 complex is essential for actin nucleation and lamellipod extension. Curr Biol. 2001;11:620–625. - PubMed
    1. Bailly M, Macaluso F, Cammer M, Chan A, Segall JE, Condeelis JS. Relationship between Arp2/3 complex and the barbed ends of actin filaments at the leading edge of carcinoma cells after epidermal growth factor stimulation. J Cell Biol. 1999;145:331–345. - PMC - PubMed
    1. Bailly M, Wyckoff J, Bouzahzah B, Hammerman R, Sylvestre V, Cammer M, Pestell R, Segall JE. Epidermal growth factor receptor distribution during chemotactic responses. Mol Biol Cell. 2000;11:3873–3883. - PMC - PubMed

Publication types

MeSH terms

LinkOut - more resources