. 2006 May;4(5):e134.
doi: 10.1371/journal.pbio.0040134. Epub 2006 Apr 25.

Microstimulation of frontal cortex can reorder a remembered spatial sequence

Affiliations

Microstimulation of frontal cortex can reorder a remembered spatial sequence

Mark H Histed et al. PLoS Biol. 2006 May.

Abstract

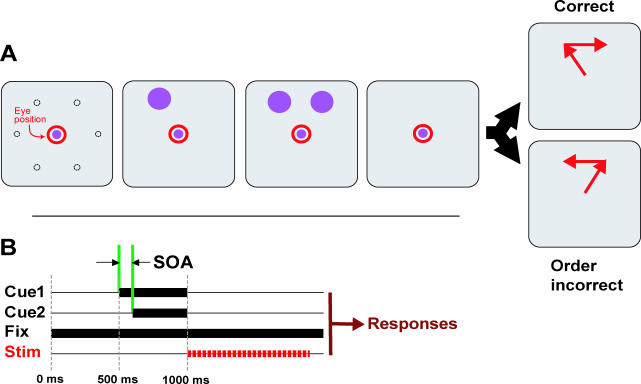
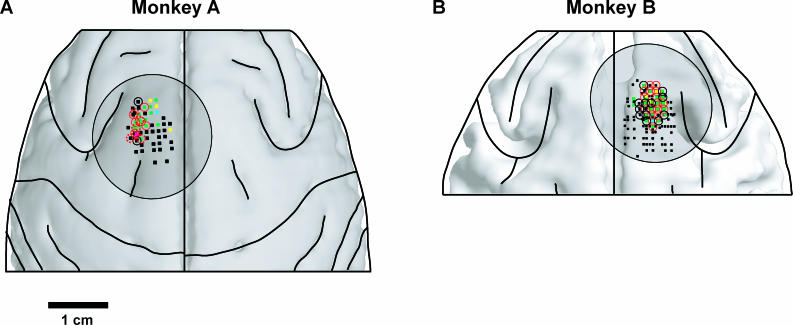
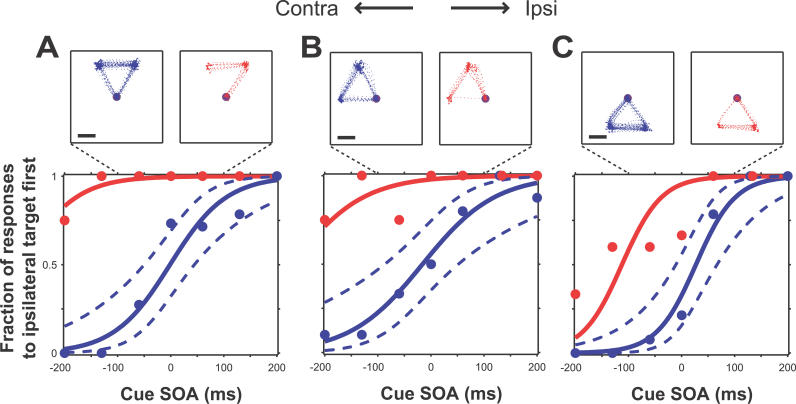
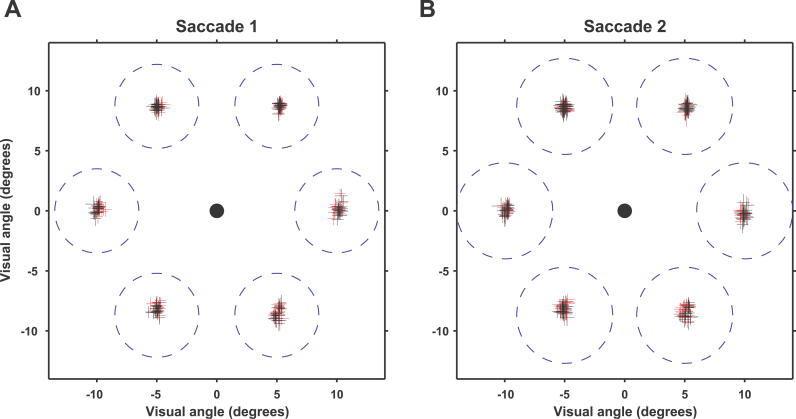
Complex goal-directed behaviors extend over time and thus depend on the ability to serially order memories and assemble compound, temporally coordinated movements. Theories of sequential processing range from simple associative chaining to hierarchical models in which order is encoded explicitly and separately from sequence components. To examine how short-term memory and planning for sequences might be coded, we used microstimulation to perturb neural activity in the supplementary eye field (SEF) while animals held a sequence of two cued locations in memory over a short delay. We found that stimulation affected the order in which animals saccaded to the locations, but not the memory for which locations were cued. These results imply that memory for sequential order can be dissociated from that of its components. Furthermore, stimulation of the SEF appeared to bias sequence endpoints to converge toward a location in contralateral space, suggesting that this area encodes sequences in terms of their endpoints rather than their individual components.


Figures

Figure 1
Figure 1. Sequential Memory Task
(A) The animals fixated a central spot for 500 ms, then the two cues appeared, separated by a short interval (the SOA). The cues were extinguished together, and the animals maintained fixation over a 1-s memory delay. To respond correctly, they then saccaded to the remembered locations of the cues in the order they appeared. Dotted circles represent possible cue locations (not displayed to animal B, visible to animal A; see Materials and Methods); cues were always presented at adjacent positions. (B) Timing of trial events. Intracortical microstimulation was applied for the first 900 ms of the 1,000-ms delay period.
Figure 2
Figure 2. Stimulation Locations in SEF
Stimulation sites are plotted relative to brain anatomy constructed from MRI images. (A) Sites in monkey A; MRI image shows the surface of the gray matter. (B) Monkey B; MRI image shows the outer surface of the white matter, i.e., the border between the gray and white matter. (This was the most salient boundary for this MRI; see Materials and Methods.) Black lines show locations of sulci, circles are locations of recording chambers. Squares, result of suprathreshold mapping stimulation (threshold less than or equal to 50 μA). Green squares show convergent saccades elicited; yellow, vector saccades; cyan, stimulation produced fixation; magenta, pursuit movements elicited; black, no effect. Red circles, stimulation caused response order bias for at least one cue pair. Black circles, no significant order effect.
Figure 3
Figure 3. Effect of Stimulation at Three SEF Sites
Psychometric behavioral curves are shown in the lower panels. Horizontal axis, SOA; vertical axis, fraction of trials where the first saccade was directed to the more ipsilateral target. Blue, unstimulated trials; red, stimulated trials. Solid lines, logistic regression curve. Dotted blue lines, simultaneous 95% confidence interval. Number of trials for each plot (stim/unstim): (A) 28/96; (B) 30/67; (C) 28/95. Upper panels: eye traces from every trial of the three central SOAs: 0, −60, and +60. Scale bar: 5°; fixation spots not drawn to scale. In each case stimulation strongly biased the animal to choose the more ipsilateral target first (and thus the more contralateral second).
Figure 4
Figure 4. Saccade Endpoint Locations Are Unchanged by Stimulation
Endpoints of first saccade (A). Endpoints of second saccade (B). (Data from animal B only; for this animal, no visual cues were available to possibly guide saccades.) Plus signs indicate mean (intersection point) and standard deviations in x and y directions (length of horizontal and vertical bar in plus symbol) of saccade endpoints over an experimental session. Stimulated endpoints are plotted in red, unstimulated endpoints in black. Blue dashed circles indicate the size of the window outside which a saccade endpoint would be considered incorrect.
Figure 5
Figure 5. Velocities and Latencies Are Unchanged by Stimulation
Peak velocities of first and second saccades, respectively (A and B). Blue region, histogram of peak saccade velocities on unstimulated trials. Thick blue lines (largely hidden by red lines), kernel density estimate of this distribution. Thick red lines, estimate of the distribution of stimulated peak velocities. (Histogram not shown.) Solid and dashed blue vertical lines, mean and s.d. of unstimulated distribution. Red tick marks (bottom), the mean peak velocity for stimulated trials for a single stimulation site. Note that all red tick marks lie within 1 s.d. of the mean of the unstimulated distribution. Latencies of first and second saccades (C and D) use the same conventions.
Figure 6
Figure 6. Stimulation Biases Endpoints toward a Contralateral Zone
The pattern of stimulation-induced bias at all pair locations from three different SEF sites (A–C). Purple arrows, the sequence that was preferred on stimulation trials. Numbers outside each pair, magnitude of the shifts (milliseconds of SOA). Psychometric curves (conventions as in Figure 2) are shown for each pair in (A).
Figure 7
Figure 7. Bias Directions Are Convergent
(A) Difference vectors around each site's mean vector. Black dots, origin of each difference vector; vectors are offset radially, so all are visible. Vector origins beyond the 90–270° vertical line (1/59; 23 expected by chance) indicate a shift direction away from the mean. (B) Cumulative distribution of absolute differences between each vector and the site's mean (summary of the effect in [A]). Red line, true distribution; black line, simulated null distribution; dashed vertical lines, medians. The distributions are significantly different ( p < 10 −6; Kolmogorov-Smirnov statistic = 0.36). (C and D) Magnitude of sequence effects. (C) Histogram of biases for pairs with one target ipsilateral and one contralateral to fixation. Horizontal axis, size of shift. Purple, statistically significant shifts ( p < 0.05); gray, non-significant shifts. Positive shifts signify that the contralateral target was chosen first, negative shifts that the contralateral target was chosen second. (D) Histogram of bias directions relative to difference vector mean direction, conventions as in (C).
Figure 8
Figure 8. Comparison of FEF and SEF Shift Magnitudes
Lines, cumulative distributions of shift magnitudes for FEF (dashed line) and SEF (solid line) sites. FEF effects are significantly weaker (Kolmogorov-Smirnov statistic, p > 10 −6); e.g., only 12% of FEF shifts are greater than or equal to 50 ms, while 48% of SEF shifts are.

Comment in

Similar articles

Cited by

References

    1. Lashley KS. The problem of serial order in behavior. In: Jeffress LA, editor. Cerebral mechanisms in behavior. New York: Wiley; 1951. pp. 112–136.
    1. Abeles M. Corticonics: Neural circuits of the cerebral cortex. Cambridge: Cambridge University Press; 1991. 280 pp.
    1. Berns GS, Sejnowski TJ. A computational model of how the basal ganglia produce sequences. J Cogn Neurosci. 1998;10:108–121. - PubMed
    1. Nakahara H, Doya K, Hikosaka O. Parallel cortico-basal ganglia mechanisms for acquisition and execution of visuomotor sequences: A computational approach. J Cogn Neurosci. 2001;13:626–647. - PubMed
    1. Hahnloser RH, Kozhevnikov AA, Fee MS. An ultra-sparse code underlies the generation of neural sequences in a songbird. Nature. 2002;419:65–70. - PubMed

Publication types