. 2006 Aug 1;108(3):986-92.
doi: 10.1182/blood-2005-08-3482. Epub 2006 Apr 18.

Transcriptional regulatory networks downstream of TAL1/SCL in T-cell acute lymphoblastic leukemia

Affiliations

Transcriptional regulatory networks downstream of TAL1/SCL in T-cell acute lymphoblastic leukemia

Teresa Palomero et al. Blood. .

Abstract

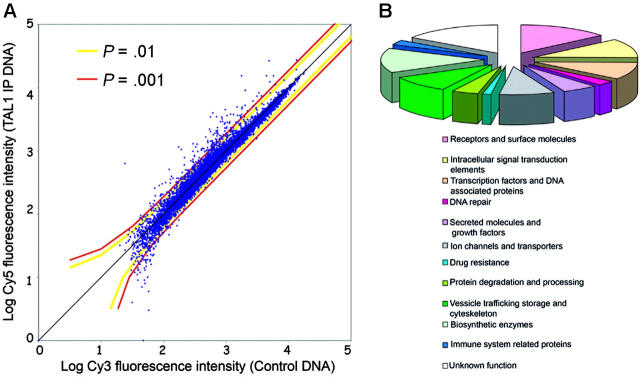
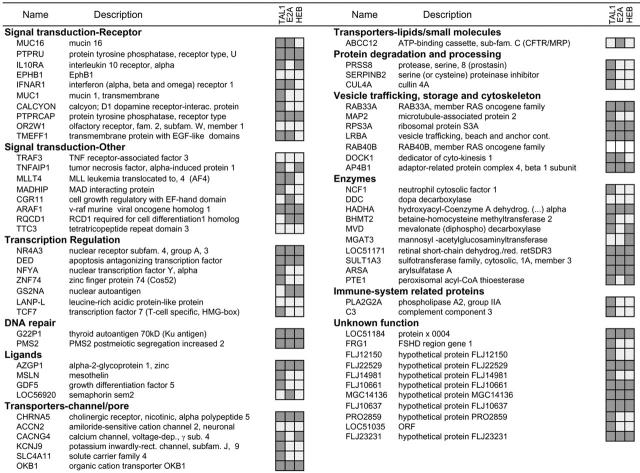
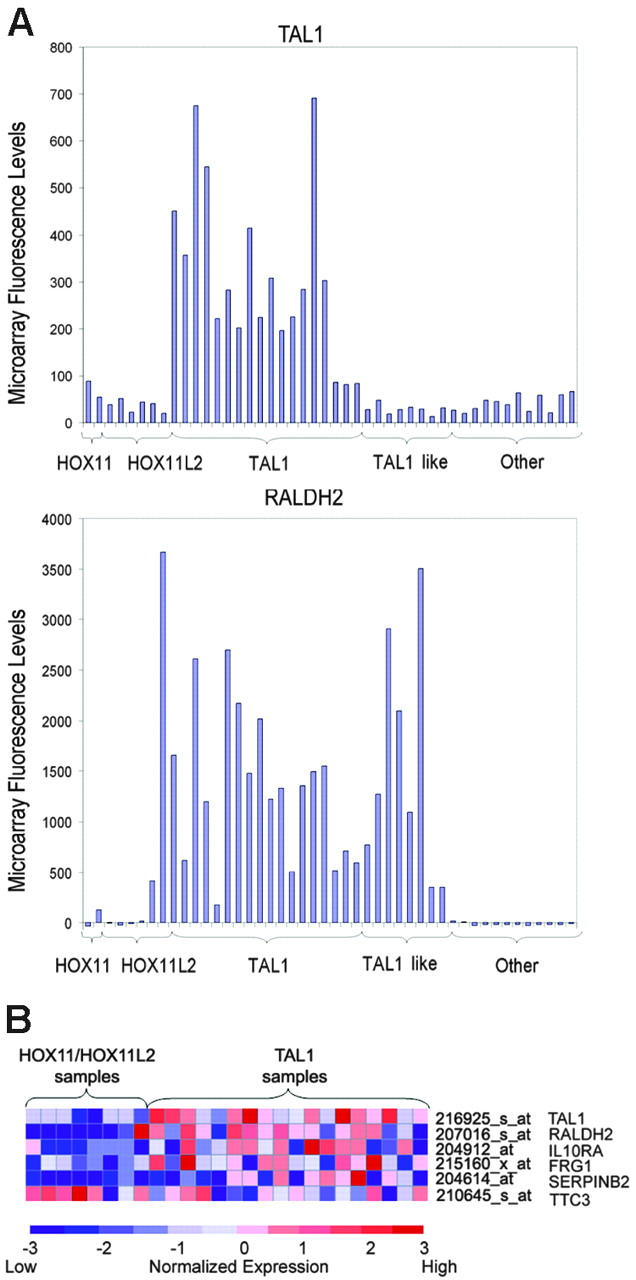
Aberrant expression of 1 or more transcription factor oncogenes is a critical component of the molecular pathogenesis of human T-cell acute lymphoblastic leukemia (T-ALL); however, oncogenic transcriptional programs downstream of T-ALL oncogenes are mostly unknown. TAL1/SCL is a basic helix-loop-helix (bHLH) transcription factor oncogene aberrantly expressed in 60% of human T-ALLs. We used chromatin immunoprecipitation (ChIP) on chip to identify 71 direct transcriptional targets of TAL1/SCL. Promoters occupied by TAL1 were also frequently bound by the class I bHLH proteins E2A and HEB, suggesting that TAL1/E2A as well as TAL1/HEB heterodimers play a role in transformation of T-cell precursors. Using RNA interference, we demonstrated that TAL1 is required for the maintenance of the leukemic phenotype in Jurkat cells and showed that TAL1 binding can be associated with either repression or activation of genes whose promoters occupied by TAL1, E2A, and HEB. In addition, oligonucleotide microarray analysis of RNA from 47 primary T-ALL samples showed specific expression signatures involving TAL1 targets in TAL1-expressing compared with -nonexpressing human T-ALLs. Our results indicate that TAL1 may act as a bifunctional transcriptional regulator (activator and repressor) at the top of a complex regulatory network that disrupts normal T-cell homeostasis and contributes to leukemogenesis.


Figures

Figure 1.
Figure 1.
Identification of TAL1 direct target genes by ChIP on chip in Jurkat cells. (A) Scatterplot representation of a genomic microarray (Hu13K) hybridization with a chromatin immunoprecipitation performed using a TAL1 antibody. The x-axis indicates the log intensity of the fluorescence of the control DNA, labeled with Cy3, while the y-axis represents the log fluorescence intensity of the TAL1 chromatin immunoprecipitates (TAL1-IP) labeled with Cy5. Each dot represents a promoter region from the Hu13K arrays. The colored lines represent the P values calculated by the error model applied to the fluorescence data. (B) Functional classification of the 71 TAL1 targets according to Gene Ontology and/or National Center for Biotechnology Information (NCBI) data for the identified genes. Note the broad spectrum of functional categories of genes regulated by TAL1.
Figure 2.
Figure 2.
Analysis of TAL1, E2A, and HEB binding to human promoters. Chromatin immunoprecipitation experiments in Jurkat cells were performed with antibodies raised against TAL1, E2A, or HEB. Relative binding to each of the 71 promoters previously identified as TAL1 targets by ChIP on chip was analyzed by gene-specific quantitative PCR. Promoters marked in dark gray were enriched in the chromatin immunoprecipitates compared with those of the control genomic DNA; no enrichment was detected in the immunoprecipitates marked in light gray, while the empty boxes for RAB40B indicates that no suitable primers were identified to perform the quantitative PCR analysis.
Figure 3.
Figure 3.
TAL1 knockdown by shRNA affects growth and gene expression in Jurkat cells. (A) Stable expression of a shRNA against TAL1 in Jurkat cells led to decreased TAL1 protein levels, as measured by Western blotting using a monoclonal antibody against TAL1. The first 2 lanes show results for 2 different clones expressing control shRNAs (Control RNAi), compared with the results of 3 separate clones expressing the TAL1-specfic shRNA in lanes 3-5 (TAL1 RNAi). The membrane was stripped and reprobed with an antibody against α-tubulin to verify equal loading. (B) Quantitative RT-PCR using RNA prepared from the same Jurkat-cell clones shown in panel A that stably express a control shRNA (formula image
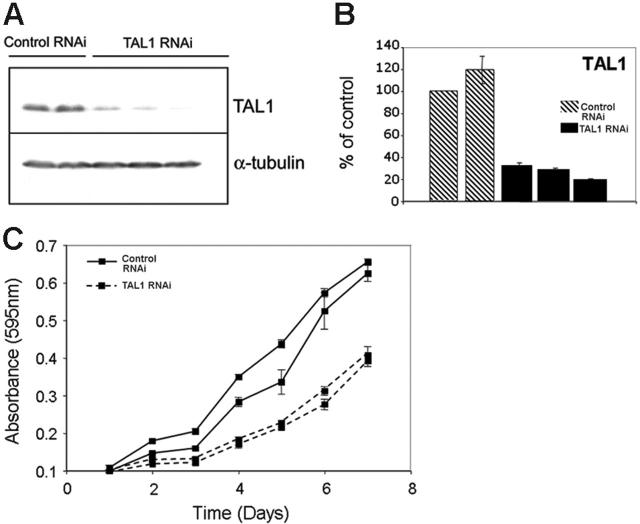
) or the TAL1 shRNA (▪) reveals 70% to 90% knockdown of TAL1 at the RNA level in TAL1 knockdown cells. Error bars indicate standard deviations. (C) TAL1 knockdown affects the growth rate of Jurkat cells. Cells (5 × 10⁴) from clones stably expressing a control or TAL1 shRNAs were plated in RPMI with 5% FBS, and the cell numbers were measured daily using an MTT-based assay.
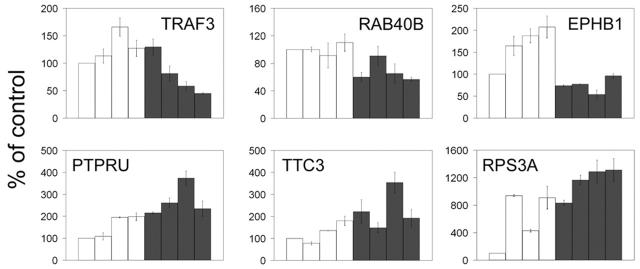
Figure 4.
Figure 4.
TAL1 knockdown reveals regulation of promoters identified by ChIP on chip. Quantitative RT-PCR on RNA prepared from 4 Jurkat-cell clones stably expressing a control shRNA (□) or the TAL1 shRNA (▪) reveals that 3 of the TAL1 target genes are significantly down-regulated by TAL1 knockdown (TRAF3, RAB40B, and EPHB1; top) and 3 are up-regulated (PTPRU, TTC3, and RPS3A; bottom), reflecting genes that would be activated and repressed by TAL1, respectively. Error bars represent standard deviations of triplicate measurements (quantification replicas) normalized to GAPDH levels. The results shown are displayed as a percentage of the mean levels of the control samples. Error bars indicate standard deviations.
Figure 5.
Figure 5.
Expression profile of TAL1-direct targets in primary T-ALL samples. (A) Microarray fluorescence intensities corresponding to the expression of TAL1 and RALDH2 genes in T-ALL samples. High levels of expression of RALDH2 were detected in all TAL1-positive cases, in agreement with a role of TAL1 in the activation of this direct target gene. Cases were arranged on the basis of the expression of T-ALL oncogenes, including HOX11, HOX11L2, and TAL1. TAL1-like cases denote samples with high levels of RALDH2 similar to those present in TAL1-positive samples, but lacking TAL1 expression. (B) Heat map representing relative expression levels of TAL1 and TAL1 direct target genes in HOX11/HOX11L2-positive cases and TAL1-positive samples. Each column represents 1 of 26 samples positive for HOX11, HOX11L2, or TAL1 by RT-PCR, while each shows the expression pattern of a particular gene identified as a TAL target by ChIP on chip. Relative expression levels are normalized across the samples; levels greater than or less than the mean are shown in shades of red or blue, respectively.

References

    1. Porcher C, Swat W, Rockwell K, Fujiwara Y, Alt FW, Orkin SH. The T cell leukemia oncoprotein SCL/tal-1 is essential for development of all hematopoietic lineages. Cell. 1996;86: 47-57. - PubMed
    1. Robb L, Begley CG. The SCL/TAL1 gene: roles in normal and malignant haematopoiesis. Bioessays. 1997;19: 607-613. - PubMed
    1. Ferrando AA, Neuberg DS, Staunton J, et al. Gene expression signatures define novel oncogenic pathways in T cell acute lymphoblastic leukemia. Cancer Cell. 2002;1: 75-87. - PubMed
    1. Ferrando AA, Neuberg DS, Dodge RK, et al. Prognostic importance of TLX1 (HOX11) oncogene expression in adults with T-cell acute lymphoblastic leukaemia. Lancet. 2004;363: 535-536. - PubMed
    1. Ferrando AA, Herblot S, Palomero T, et al. Biallelic transcriptional activation of oncogenic transcription factors in T-cell acute lymphoblastic leukemia. Blood. 2004;103: 1909-1911. - PubMed

Publication types

MeSH terms

Substances