

Microarray analyses of peripheral blood cells identifies unique gene expression signature in psoriatic arthritis
- PMID: 16622521
- PMCID: PMC1449519
- DOI: 10.2119/2006-00003.Gulko
Microarray analyses of peripheral blood cells identifies unique gene expression signature in psoriatic arthritis
Abstract
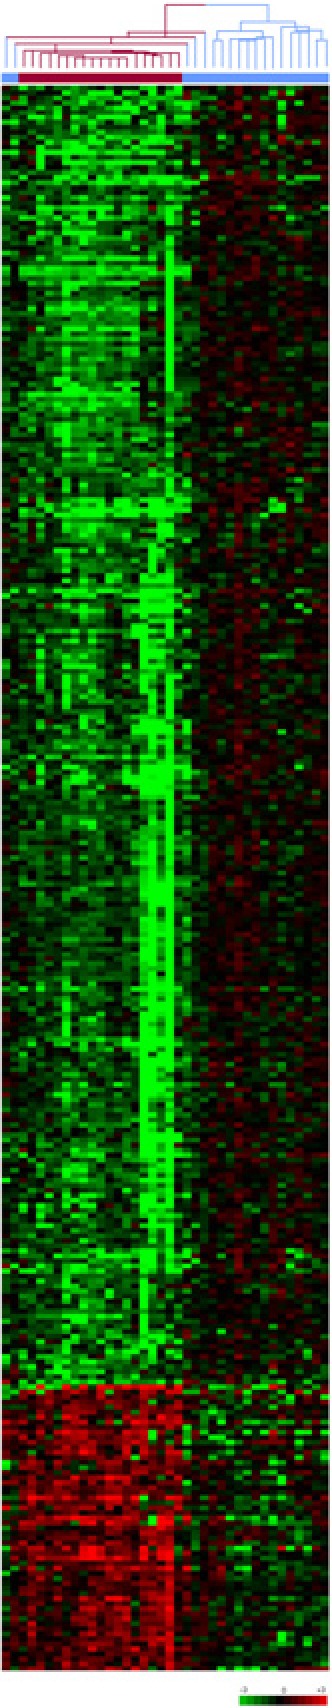
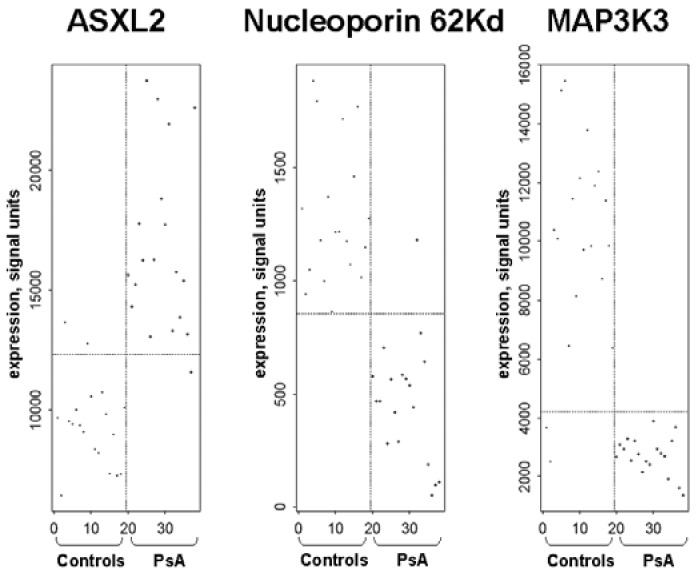
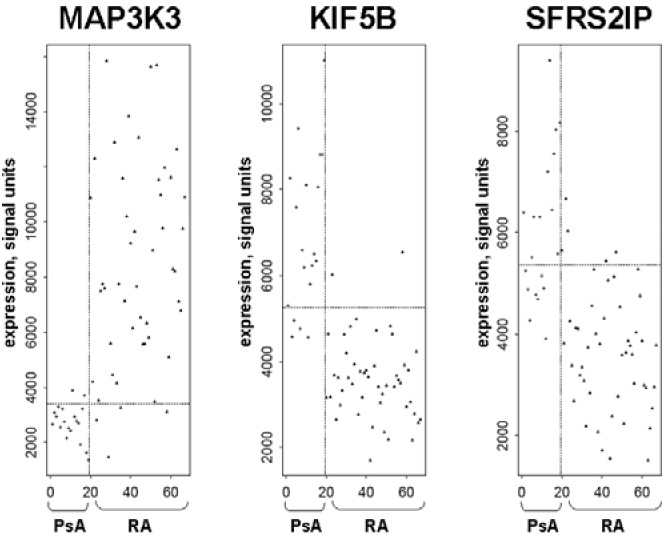
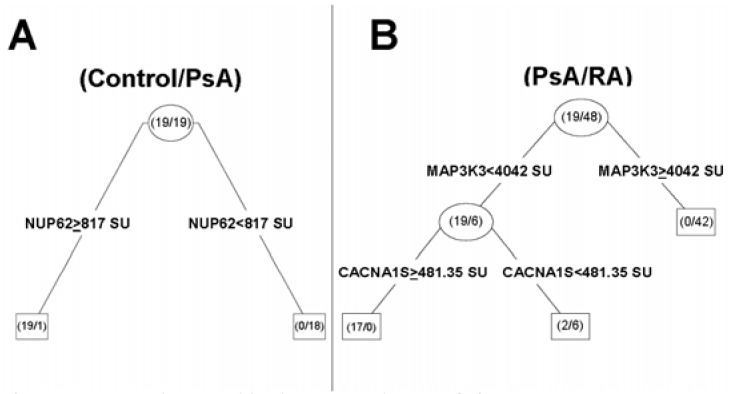
Psoriatic arthritis (PsA) is a chronic and erosive form of arthritis of unknown cause. We aimed to characterize the PsA phenotype using gene expression profiling and comparing it with healthy control subjects and patients rheumatoid arthritis (RA). Peripheral blood cells (PBCs) of 19 patients with active PsA and 19 age- and sex-matched control subjects were used in the analyses of PsA, with blood samples collected in PaxGene tubes. A significant alteration in the pattern of expression of 313 genes was noted in the PBCs of PsA patients on Affymetrix U133A arrays: 257 genes were expressed at reduced levels in PsA, and 56 genes were expressed at increased levels, compared with controls. Downregulated genes tended to cluster to certain chromosomal regions, including those containing the psoriasis susceptibility loci PSORS1 and PSORS2. Among the genes with the most significantly reduced expression were those involved in downregulation or suppression of innate and acquired immune responses, such as SIGIRR, STAT3, SHP1, IKBKB, IL-11RA, and TCF7, suggesting inappropriate control that favors proin-flammatory responses. Several members of the MAPK signaling pathway and tumor suppressor genes showed reduced expression. Three proinflammatory genes--S100A8, S100A12, and thioredoxin--showed increased expression. Logistic regression and recursive partitioning analysis determined that one gene, nucleoporin 62 kDa, could correctly classify all controls and 94.7% of the PsA patients. Using a dataset of 48 RA samples for comparison, the combination of two genes, MAP3K3 followed by CACNA1S, was enough to correctly classify all RA and PsA patients. Thus, PBC gene expression profiling identified a gene expression signature that differentiated PsA from RA, and PsA from controls. Several novel genes were differentially expressed in PsA and may prove to be diagnostic biomarkers or serve as new targets for the development of therapies.
Figures
Similar articles
-
Th17 gene expression in psoriatic arthritis synovial fluid and peripheral blood compared to osteoarthritis and cutaneous psoriasis.Clin Exp Rheumatol. 2018 May-Jun;36(3):486-489. Epub 2017 Nov 9. Clin Exp Rheumatol. 2018. PMID: 29148410
-
Gene Expression Profiling in Peripheral Blood Cells and Synovial Membranes of Patients with Psoriatic Arthritis.PLoS One. 2015 Jun 18;10(6):e0128262. doi: 10.1371/journal.pone.0128262. eCollection 2015. PLoS One. 2015. PMID: 26086874 Free PMC article.
-
Distinct genetic profile in peripheral blood mononuclear cells of psoriatic arthritis patients treated with methotrexate and TNF-inhibitors.Clin Rheumatol. 2014 Dec;33(12):1815-21. doi: 10.1007/s10067-014-2807-8. Epub 2014 Oct 24. Clin Rheumatol. 2014. PMID: 25339124
-
Novel findings from determination of common expressed plasma exosomal microRNAs in patients with psoriatic arthritis, psoriasis vulgaris, rheumatoid arthritis, and gouty arthritis.Discov Med. 2019 Jul;28(151):47-68. Discov Med. 2019. PMID: 31465725
-
Genetics of psoriatic arthritis.Best Pract Res Clin Rheumatol. 2014 Oct;28(5):673-85. doi: 10.1016/j.berh.2014.10.010. Epub 2014 Nov 22. Best Pract Res Clin Rheumatol. 2014. PMID: 25488777 Review.
Cited by
-
cDNA targets improve whole blood gene expression profiling and enhance detection of pharmocodynamic biomarkers: a quantitative platform analysis.J Transl Med. 2010 Sep 25;8:87. doi: 10.1186/1479-5876-8-87. J Transl Med. 2010. PMID: 20868515 Free PMC article.
-
Guselkumab Modulates Differentially Expressed Genes in Blood of Patients With Psoriatic Arthritis: Results from Two Phase 3, Randomized, Placebo-Controlled Trials.ACR Open Rheumatol. 2023 Sep;5(9):490-498. doi: 10.1002/acr2.11589. Epub 2023 Aug 8. ACR Open Rheumatol. 2023. PMID: 37553909 Free PMC article.
-
Single Immunoglobulin IL-1-Related Receptor (SIGIRR) Gene rs7396562 Polymorphism and Expression Level in Rheumatoid Arthritis.Biomed Res Int. 2021 May 7;2021:6683148. doi: 10.1155/2021/6683148. eCollection 2021. Biomed Res Int. 2021. PMID: 34036103 Free PMC article.
-
Regulatory Role of IL-1R8 in Immunity and Disease.Front Immunol. 2016 Apr 20;7:149. doi: 10.3389/fimmu.2016.00149. eCollection 2016. Front Immunol. 2016. PMID: 27148268 Free PMC article. Review.
-
A perspective on HPK1 as a novel immuno-oncology drug target.Elife. 2020 Sep 8;9:e55122. doi: 10.7554/eLife.55122. Elife. 2020. PMID: 32896273 Free PMC article. Review.
References
Publication types
MeSH terms
Grants and funding
LinkOut - more resources
Full Text Sources
Other Literature Sources
Medical
Research Materials
Miscellaneous