

doi: 10.1534/genetics.106.057927.
Epub 2006 Apr 19.
Mapping novel traits by array-assisted bulk segregant analysis in Saccharomyces cerevisiae
Affiliations
- PMID: 16624899
- PMCID: PMC1526703
- DOI: 10.1534/genetics.106.057927
Item in Clipboard
Mapping novel traits by array-assisted bulk segregant analysis in Saccharomyces cerevisiae
Genetics.
2006 Jul.
Abstract
We demonstrate a new method, microarray-assisted bulk segregant analysis, for mapping traits in yeast by genotyping pooled segregants. We apply a probabilistic model to the progeny of a single cross and as little as two microarray hybridizations to reliably map an auxotrophic marker, a Mendelian trait, and a major-effect quantitative trait locus.
Figures
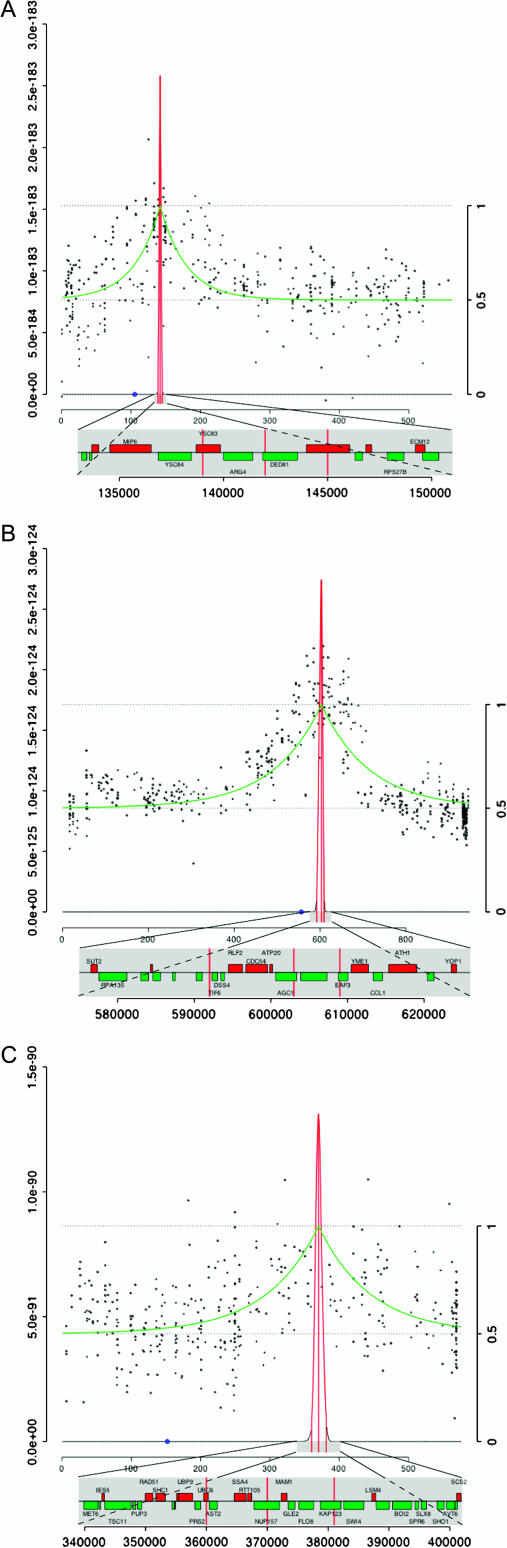
Mapping of the locus for (A) a known arginine auxotrophy, (B) an unknown acetate growth defect, and (C) a major QTL involved in flocculation. For each experiment, 10 μg of DNA from each parent strain or pool was labeled as described (Winzeler et al. 1999) and hybridized to Affymetrix (Santa Clara, CA) YG-S98 GeneChip microarrays. Hybridized arrays were washed using the Affymetrix fluidics station, scanned with a GeneChip Scanner 3000, and analyzed with Affymetrix software to obtain the signal intensity for each feature (the “CEL” file). A detailed protocol is available as supplemental data at http://genomics-pubs.princeton.edu/snappy . Signal variation caused by location-specific artifacts was calculated for each feature by computing the mean intensity within a 37 × 37-feature window centered on that feature. This variation was subtracted from each feature on the array. The resulting normalized hybridization values from each feature were log transformed, averaged over hybridization replicates, and stored for further analysis. Using the parental strain hybridizations, 7236 SFPs were identified between SK1 and FY, and 5787 between Y55 and FY. Hybridization intensity data for these probes were scaled for each pool so that the reference parent had a value of 1.0, while the divergent parent's value was 0.0. Scaled and normalized data (shown as black dots) were applied to a likelihood model of recombination (best fit shown in green) to more precisely map the region of the chromosome most tightly linked to the gene of interest. The interval marked by the outer red vertical lines corresponds to the region containing loci with likelihood ratios of >20. Raw and processed data are available as supplemental data at http://genomics-pubs.princeton.edu/snappy , and analysis scripts are available upon request.
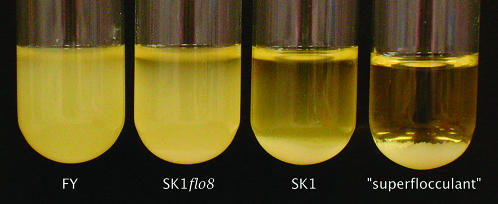
Flocculation phenotype of FY, SK1flo8, SK1, and a “superflocculent” segregant. Saturated cultures in rich media were vortexed and allowed to settle for 10 min. FLO8 was deleted and replaced with URA3 by a standard one-step transformation procedure and then checked by PCR.
References
-
- Brem, R. B., G. Yvert, R. Clinton and L. Kruglyak, 2002. Genetic dissection of transcriptional regulation in budding yeast. Science 296: 752–755. - PubMed
-
- Deutschbauer, A. M., and R. W. Davis, 2005. Quantitative trait loci mapped to single-nucleotide resolution in yeast. Nat. Genet. 37: 1333–1340. - PubMed
-
- Ellis, T. P., K. G. Helfenbein, A. Tzagoloff and C. L. Dieckmann, 2004. Aep3p stabilizes the mitochondrial bicistronic mRNA encoding subunits 6 and 8 of the H+-translocating ATP synthase of Saccharomyces cerevisiae. J. Biol. Chem. 279: 15728–15733. - PubMed
-
- Gresham, D., D. M. Ruderfer, S. C. Pratt, J. Schacherer, M. J. Dunham et al., 2006. Genome-wide detection of polymorphisms at nucleotide resolution with a single DNA microarray. Science 311: 1932–1936. - PubMed
Publication types
MeSH terms
Grants and funding
LinkOut - more resources
Full Text Sources
Other Literature Sources
Molecular Biology Databases
