

On locating multiple interacting quantitative trait loci in intercross designs
- PMID: 16624924
- PMCID: PMC1526676
- DOI: 10.1534/genetics.105.048108
On locating multiple interacting quantitative trait loci in intercross designs
Abstract
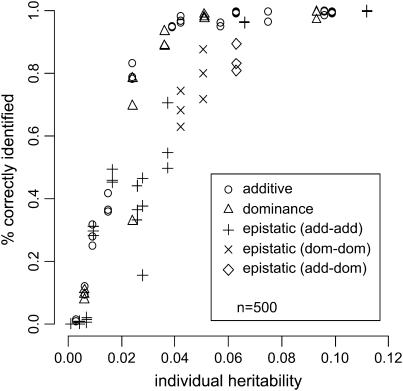
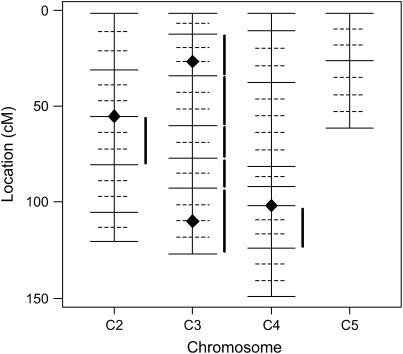
A modified version (mBIC) of the Bayesian Information Criterion (BIC) has been previously proposed for backcross designs to locate multiple interacting quantitative trait loci. In this article, we extend the method to intercross designs. We also propose two modifications of the mBIC. First we investigate a two-stage procedure in the spirit of empirical Bayes methods involving an adaptive (i.e., data-based) choice of the penalty. The purpose of the second modification is to increase the power of detecting epistasis effects at loci where main effects have already been detected. We investigate the proposed methods by computer simulations under a wide range of realistic genetic models, with nonequidistant marker spacings and missing data. In the case of large intermarker distances we use imputations according to Haley and Knott regression to reduce the distance between searched positions to not more than 10 cM. Haley and Knott regression is also used to handle missing data. The simulation study as well as real data analyses demonstrates good properties of the proposed method of QTL detection.
Figures
Similar articles
-
Locating multiple interacting quantitative trait Loci using rank-based model selection.Genetics. 2007 Jul;176(3):1845-54. doi: 10.1534/genetics.106.068031. Epub 2007 May 16. Genetics. 2007. PMID: 17507685 Free PMC article.
-
An improved method for quantitative trait loci detection and identification of within-line segregation in F2 intercross designs.Genetics. 2008 Apr;178(4):2315-26. doi: 10.1534/genetics.107.083162. Genetics. 2008. PMID: 18430952 Free PMC article.
-
Modifying the Schwarz Bayesian information criterion to locate multiple interacting quantitative trait loci.Genetics. 2004 Jun;167(2):989-99. doi: 10.1534/genetics.103.021683. Genetics. 2004. PMID: 15238547 Free PMC article.
-
Extending the modified bayesian information criterion (mBIC) to dense markers and multiple interval mapping.Biometrics. 2008 Dec;64(4):1162-9. doi: 10.1111/j.1541-0420.2008.00989.x. Epub 2008 Feb 11. Biometrics. 2008. PMID: 18266892
-
Current progress on statistical methods for mapping quantitative trait loci from inbred line crosses.J Biopharm Stat. 2010 Mar;20(2):454-81. doi: 10.1080/10543400903572845. J Biopharm Stat. 2010. PMID: 20309768 Review.
Cited by
-
New insights into the genetics of in vivo induction of maternal haploids, the backbone of doubled haploid technology in maize.Genetics. 2012 Feb;190(2):781-93. doi: 10.1534/genetics.111.133066. Epub 2011 Nov 30. Genetics. 2012. PMID: 22135357 Free PMC article.
-
Locating multiple interacting quantitative trait Loci using rank-based model selection.Genetics. 2007 Jul;176(3):1845-54. doi: 10.1534/genetics.106.068031. Epub 2007 May 16. Genetics. 2007. PMID: 17507685 Free PMC article.
-
A model selection approach for the identification of quantitative trait loci in experimental crosses, allowing epistasis.Genetics. 2009 Mar;181(3):1077-86. doi: 10.1534/genetics.108.094565. Epub 2008 Dec 22. Genetics. 2009. PMID: 19104078 Free PMC article.
-
High-density genotyping: an overkill for QTL mapping? Lessons learned from a case study in maize and simulations.Theor Appl Genet. 2013 Oct;126(10):2563-74. doi: 10.1007/s00122-013-2155-0. Epub 2013 Jul 17. Theor Appl Genet. 2013. PMID: 23860723
-
Genetic architecture of male fertility restoration of Triticum timopheevii cytoplasm and fine-mapping of the major restorer locus Rf3 on chromosome 1B.Theor Appl Genet. 2017 Jun;130(6):1253-1266. doi: 10.1007/s00122-017-2885-5. Epub 2017 Mar 21. Theor Appl Genet. 2017. PMID: 28326434
References
-
- Akaike, H., 1974. A new look at the statistical model identification. IEEE Trans. Automat. Control AC-19: 716–723.
-
- Bogdan, M., and R. W. Doerge, 2005. Biased estimators of quantitative trait locus heritability and location in interval mapping. Heredity 95: 476–484. - PubMed
MeSH terms
Substances
LinkOut - more resources
Full Text Sources
Molecular Biology Databases
