Comparative Study
. 2006 Apr 19;26(16):4166-77.
doi: 10.1523/JNEUROSCI.0176-06.2006.

Two coincidence detectors for spike timing-dependent plasticity in somatosensory cortex

Affiliations
Comparative Study

Two coincidence detectors for spike timing-dependent plasticity in somatosensory cortex

Vanessa A Bender et al. J Neurosci. .

Abstract

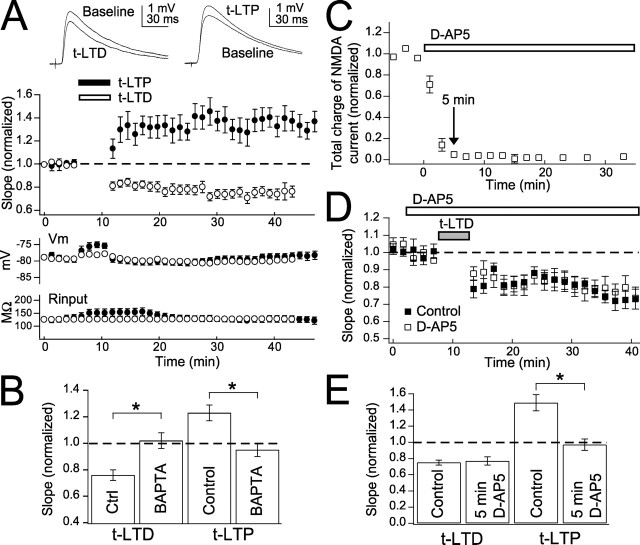
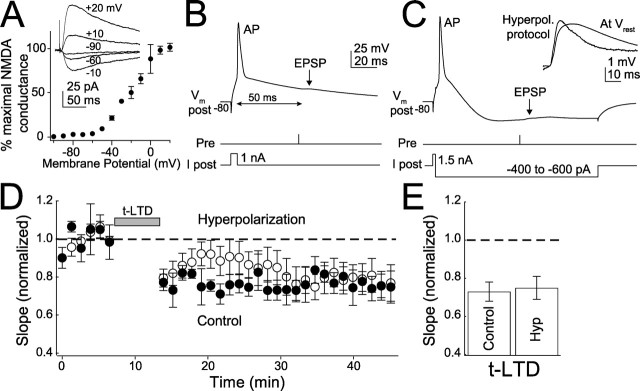
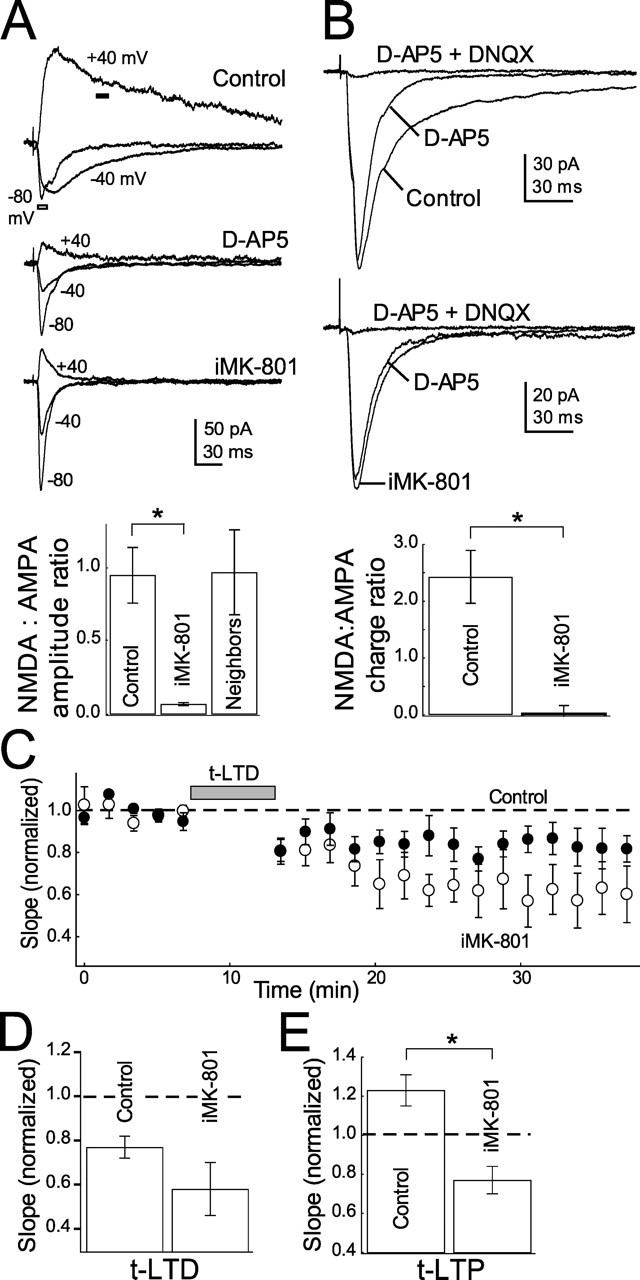
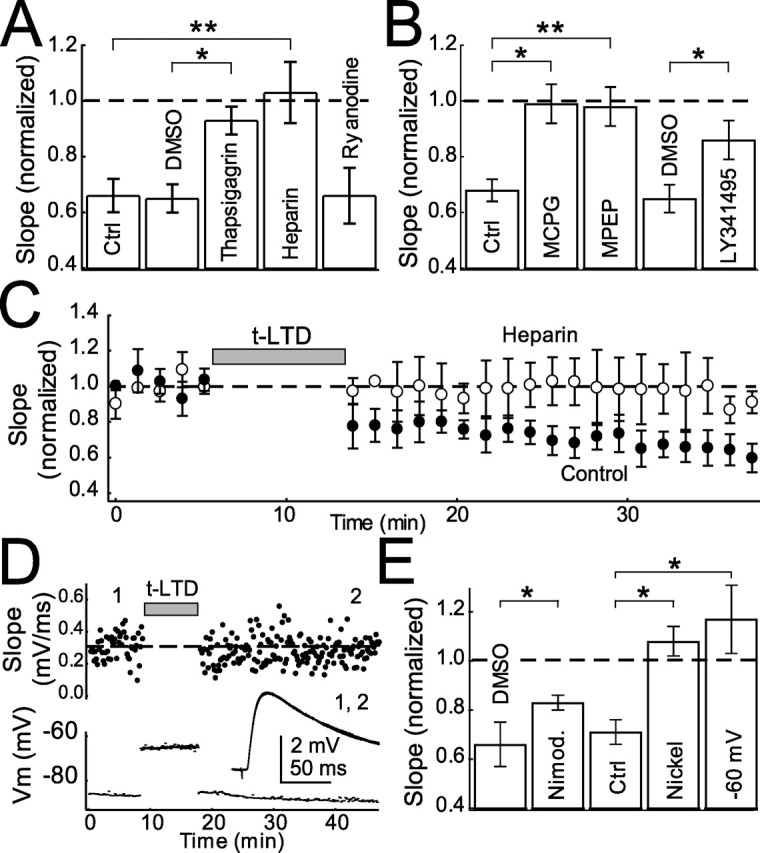
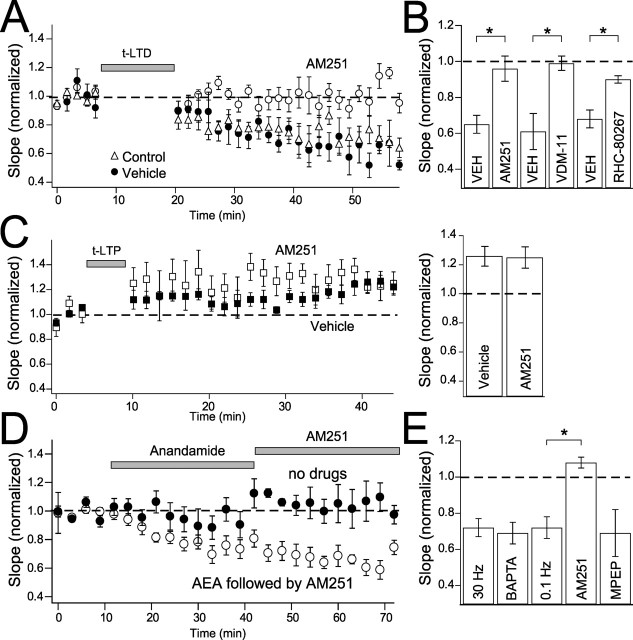
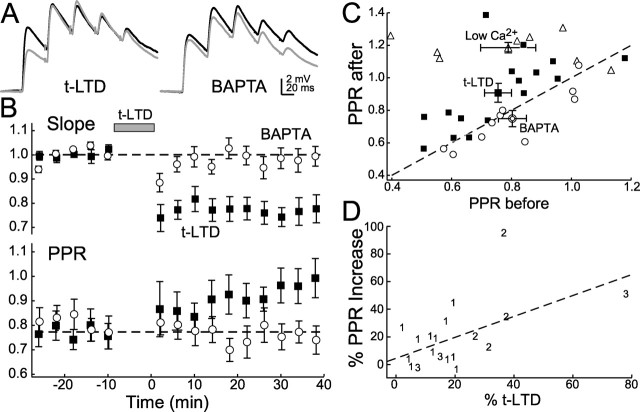
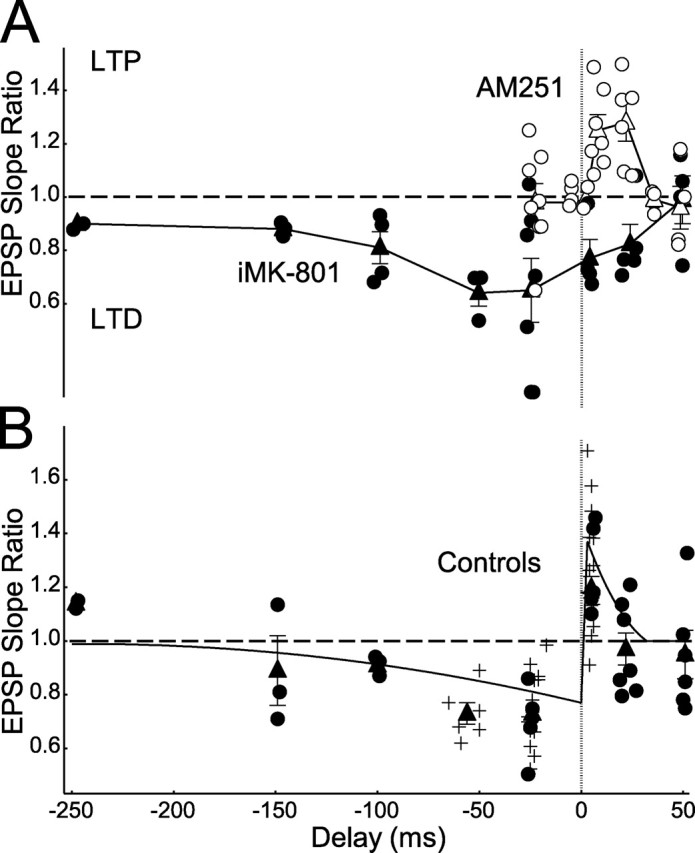
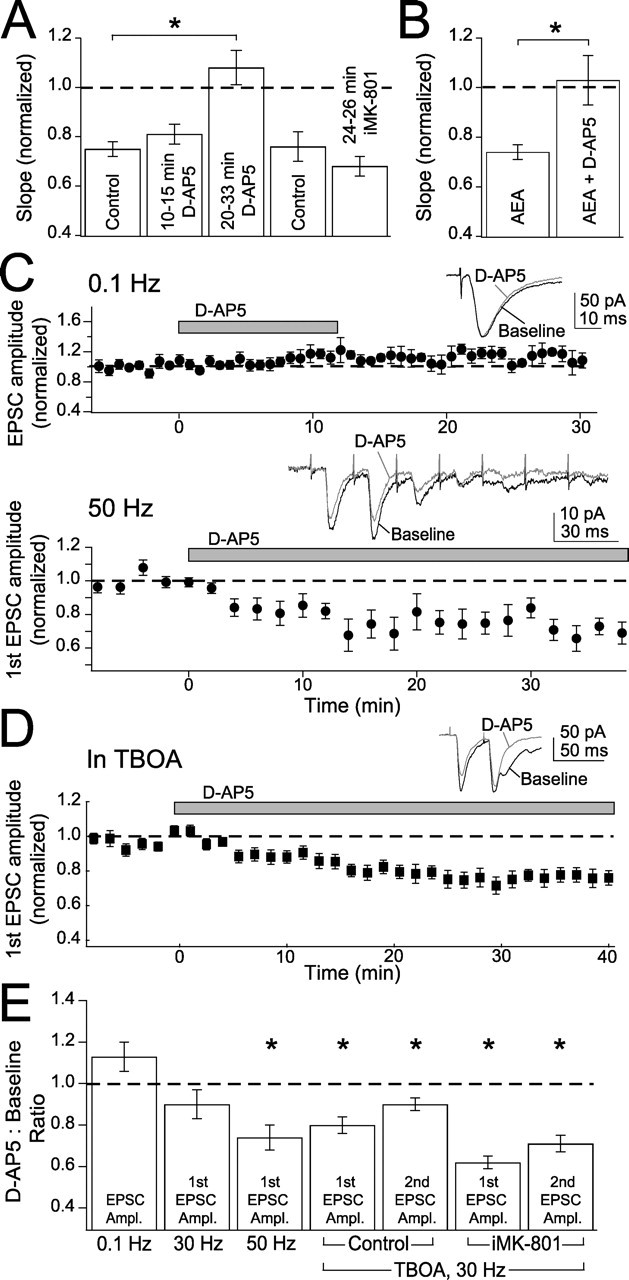
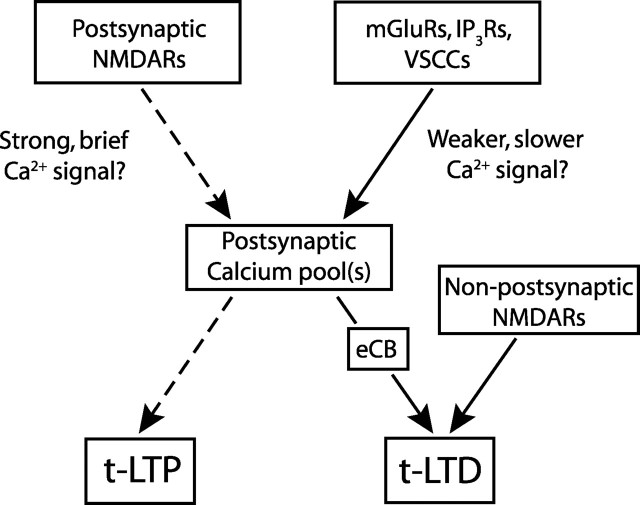
Many cortical synapses exhibit spike timing-dependent plasticity (STDP) in which the precise timing of presynaptic and postsynaptic spikes induces synaptic strengthening [long-term potentiation (LTP)] or weakening [long-term depression (LTD)]. Standard models posit a single, postsynaptic, NMDA receptor-based coincidence detector for LTP and LTD components of STDP. We show instead that STDP at layer 4 to layer 2/3 synapses in somatosensory (S1) cortex involves separate calcium sources and coincidence detection mechanisms for LTP and LTD. LTP showed classical NMDA receptor dependence. LTD was independent of postsynaptic NMDA receptors and instead required group I metabotropic glutamate receptors and calcium from voltage-sensitive channels and IP3 receptor-gated stores. Downstream of postsynaptic calcium, LTD required retrograde endocannabinoid signaling, leading to presynaptic LTD expression, and also required activation of apparently presynaptic NMDA receptors. These LTP and LTD mechanisms detected firing coincidence on approximately 25 and approximately 125 ms time scales, respectively, and combined to implement the overall STDP rule. These findings indicate that STDP is not a unitary process and suggest that endocannabinoid-dependent LTD may be relevant to cortical map plasticity.


Figures

Figure 1.
Figure 1.
t-LTP and t-LTD at L4-L2/3 synapses are sensitive to d-AP5 and BAPTA. A, Top left, Representative EPSPs before and after t-LTD induction. Top right, Representative EPSPs before and after t-LTP induction. Middle, Mean time course of t-LTP and t-LTD. Open circles, t-LTD; closed circles, t-LTP. Bottom, Mean Vm and input resistance to show stability of recordings. B, t-LTD and t-LTP are blocked by postsynaptic BAPTA (5 mm). C, Time course of blockade of NMDA currents by d-AP5 (50 μm). The arrow marks 5 min from the beginning of d-AP5 application. D, Mean effect of 5 min of d-AP5 application before pairing (open squares). Closed squares are interleaved controls. E, Five minute d-AP5 application blocks t-LTP but not t-LTD. The summary of the effect of 5 min of d-AP5 application before pairing on t-LTD and t-LTP is shown. Error bars are SEM. ∗p < 0.05.
Figure 2.
Figure 2.
Hyperpolarization does not block t-LTD. A, Voltage dependence of synaptically evoked NMDA receptor conductance at L4-L2/3 synapses (normalized to maximal conductance for each of 3 cells). Inset, Representative NMDA receptor currents (measured in 10 μm DNQX). Holding potentials are indicated. B, Standard protocol for t-LTD induction (50 ms post-leading-pre pairing). Pre, Time of extracellular presynaptic stimulation. C, Hyperpolarization (Hyperpol.) protocol for t-LTD induction. After initiating the postsynaptic spike, current was injected to strongly hyperpolarize the postsynaptic cell before arrival of the EPSP. Inset, Representative EPSPs recorded showing increased driving force during the hyperpolarization protocol compared with Vrest. D, Effect of hyperpolarization on t-LTD induction (50–60 ms post-leading-pre pairing). E, Summary of t-LTD magnitude. Hyp, Hyperpolarization.
Figure 3.
Figure 3.
Blockade of postsynaptic NMDA currents by internal MK-801 does not block t-LTD. A, iMK-801 (1 mm) substantially blocks NMDA currents measured at +40 mV. Top, Representative EPSCs measured in control cells and in the presence of 50 μm d-AP5 and 1 mm internal MK-801. Holding potentials are indicated. Bottom, Quantification of NMDA (amplitude of current at +40 mV at dark bar in A1) to AMPA (amplitude of current at −80 mV at outlined bar in A) current ratios in control, d-AP5, iMK-801 conditions and cells recorded with normal internal within 10 μm of cells recorded with iMK-801 (neighbors). B, iMK-801 also blocks NMDA currents at −60 mV. Top, Representative EPSCs recorded at −60 mV in low (0.4 mm) Mg2+ Ringer’s solution in control (top) and MK-801 (bottom) internals in normal Ringer’s solution, 50 μm d-AP5 and 10 μm DNQX. Bottom, Quantification of the NMDA:AMPA current integral ratio (see Materials and Methods) for all cells tested. C, iMK-801 does not block t-LTD. The net effect of iMK-801 on t-LTD is plotted with interleaved controls. Open circles, iMK-801; closed circles, interleaved controls. D, Summary of the effect of iMK-801 on t-LTD. E, iMK-801 does block t-LTP. Error bars show mean ± SEM. *p < 0.05.
Figure 4.
Figure 4.
Calcium sources for t-LTD. A, Summary of effect of blocking calcium release from internal stores with thapsigargin (10 μm), heparin (400 U/ml), and ryanodine (100 μm) in the postsynaptic pipette on t-LTD. B, Effect of general mGluR antagonists MCPG (0.5–1 mm), LY341495 (100 μm), and a specific mGluR5 antagonist (MPEP, 10 μm) on t-LTD. C, Effect of heparin on t-LTD. D, Example of post–pre pairing (−24 ms) with postsynaptic cell resting at −60 mV between spikes. Top, Each point represents individual EPSPs. The dashed line represents average slope during baseline. Bottom, Inset, Average EPSPs before (1) and after (2) protocol. E, Mean effect of nimodipine (1–20 μm), −60 mV resting between spikes, and NiCl2 (50 μm) on t-LTD with appropriate controls. Error bars show mean ± SEM. Ctrl, Control. ∗p < 0.05; **p < 0.01.
Figure 5.
Figure 5.
Cannabinoid dependence of t-LTD. A, AM251 (3 μm) completely blocks t-LTD. t-LTD in the presence of AM251 (open circles), DMSO alone (closed circles), and normal Ringer’s solution (open triangles). B, Mean effect of AM251, VDM-11 (10–20 μm), and RHC80267 (50 μm) on t-LTD with relevant vehicle controls. C, AM251 has no effect on t-LTP. t-LTP in the presence of AM251 (open squares) and ethanol vehicle alone (closed squares). Right, Mean effect of AM251 on t-LTP. D, Anandamide (AEA) wash-in with presynaptic stimulation induces long-lasting depression. Open circles show cells with anandamide (40 μm) and subsequent AM251 wash-in at 0.1 and 30 Hz. Closed circles are interleaved controls with presynaptic stimulation alone. E, Mean effect of anandamide wash-in at 30 and 0.1 Hz, with postsynaptic BAPTA (5 mm; 30 Hz), AM251 (3 μm; 0.1 Hz), and MPEP (10 μm; 0.1 Hz). ∗p < 0.05.
Figure 6.
Figure 6.
t-LTD changes paired-pulse ratios. A, Left, Example of change in paired-pulse ratio before (black lines) and after (gray lines) induction of t-LTD. Right, t-LTD and changes in PPR are blocked by postsynaptic BAPTA. B, Top, Closed squares, t-LTD induced with baseline stimulation of five pulses at 25 Hz. Open circles, t-LTD with 10 mm BAPTA in the postsynaptic pipette. Bottom, Same symbols as top. Three cells in which significant t-LTD was not induced are not included. C, Summary of changes in PPR before and after t-LTD induction (open circles), normal to low Ca2+ (open triangles), and t-LTD with postsynaptic BAPTA (open squares). Dashed line, No change in PPR. D, Regression (dashed line) showing the increase in PPR versus the magnitude of t-LTD induction. Symbols 1, 2, and 3 refer to t-LTD induced with 100, 200, and 300 pairings, respectively.
Figure 7.
Figure 7.
Spike-timing windows of pharmacologically isolated t-LTP and t-LTD. A, STDP measured in the presence of AM251 (open circles, individual cells; open triangles, means and SEM) and iMK-801 (closed circles, individual cells; closed triangles, means and SEM) to isolate t-LTP and t-LTD signaling pathways, respectively. B, STDP timing window under control conditions. Curve, Mean STDP at this synapse from previously published data (Feldman, 2000; Celikel et al., 2004); closed circles, new control cells that were interleaved with data in A; plus signs, other control cells from the present study (not interleaved with data in A); closed triangles, control means and SEM.
Figure 8.
Figure 8.
Non-postsynaptic NMDA receptors are required for t-LTD and anandamide-induced synaptic depression. A, Intermediate duration (10–15 min) d-AP5 (50 μm) does not block t-LTD, but long-duration (20–33 min) d-AP5 does block t-LTD. Long-duration (24–26 min) internal MK-801 does not block t-LTD. This indicates that postsynaptic NMDA receptors are not the source of slow modulation of t-LTD. B, Bath-applying d-AP5 for 20 min or longer blocks anandamide (AEA)-induced synaptic depression, relative to interleaved control cells with no d-AP5. C, d-AP5 does not block synaptically evoked AMPA receptor currents measured in voltage clamp at −90 mV in single pulses at 0.1 Hz (top) but does block currents when seven pulses are evoked at 50 Hz (bottom). Insets, Single examples of AMPA currents before (black) and after d-AP5 (gray). D, d-AP5 does block AMPA currents measured at −90 mV in trains of two pulses at 30 Hz in the presence of 25 μm TBOA. Inset, Single example of AMPA currents before (black) and after d-AP5 (gray). E, Summary of effects of d-AP5 on the amplitudes (Ampl.) of the first and second EPSCs at 0.1, 30, and 50 Hz and 30 Hz in the presence of TBOA, under normal conditions (control), and in the presence of internal MK-801 (iMK-801). Asterisks indicate significance from baseline using a paired t test.
Figure 9.
Figure 9.
Model for STDP at L4-L2/3 synapses. Separate proposed coincidence detectors for LTP and LTD components of STDP. Postsynaptic NMDA receptors are proposed to be the coincidence detector and calcium source for t-LTP (dashed lines). t-LTD induction protocols are proposed to activate the mGluR-VSCC-IP3R pathway to generate postsynaptic calcium, which drives eCB synthesis, leading to retrograde signaling and presynaptic expression of t-LTD. Non-postsynaptic, potentially presynaptic NMDARs are also required for t-LTD. Whether millisecond scale coincidence detection is performed by the mGluR-VSCC-IP3R module or by eCB-presynaptic NMDAR signaling is unknown. Whether t-LTP and t-LTD share a common or separate pools of dendritic calcium is also unknown.

Similar articles

Cited by

References

    1. Abbott LF, Nelson SB (2000). Synaptic plasticity: taming the beast. Nat Neurosci 3:Suppl, 1178–1183. - PubMed
    1. Allen CB, Celikel T, Feldman DE (2003). Long-term depression induced by sensory deprivation during cortical map plasticity in vivo. Nat Neurosci 6:291–299. - PubMed
    1. Anwyl R (1999). Metabotropic glutamate receptors: electrophysiological properties and role in plasticity. Brain Res Brain Res Rev 29:83–120. - PubMed
    1. Aoki C, Venkatesan C, Go CG, Mong JA, Dawson TM (1994). Cellular and subcellular localization of NMDA-R1 subunit immunoreactivity in the visual cortex of adult and neonatal rats. J Neurosci 14:5202–5222. - PMC - PubMed
    1. Artola A, Singer W (1993). Long-term depression of excitatory synaptic transmission and its relationship to long-term potentiation. Trends Neurosci 16:480–487. - PubMed

Publication types

MeSH terms