Comparative Study
. 2006 Apr 19;26(16):4206-15.
doi: 10.1523/JNEUROSCI.0496-06.2006.

Light-induced changes in spike synchronization between coupled ON direction selective ganglion cells in the mammalian retina

Affiliations
Comparative Study

Light-induced changes in spike synchronization between coupled ON direction selective ganglion cells in the mammalian retina

Jessica M Ackert et al. J Neurosci. .

Abstract

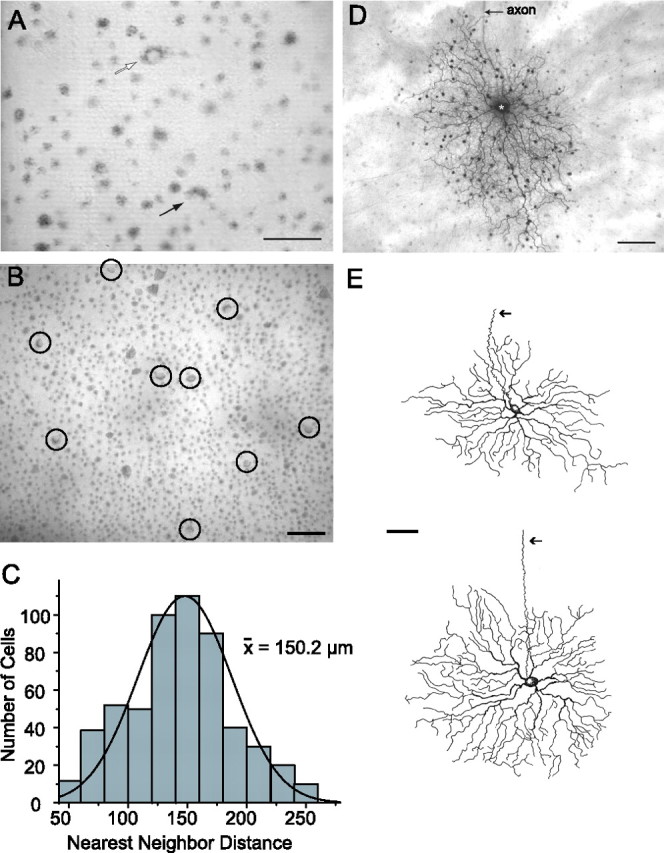
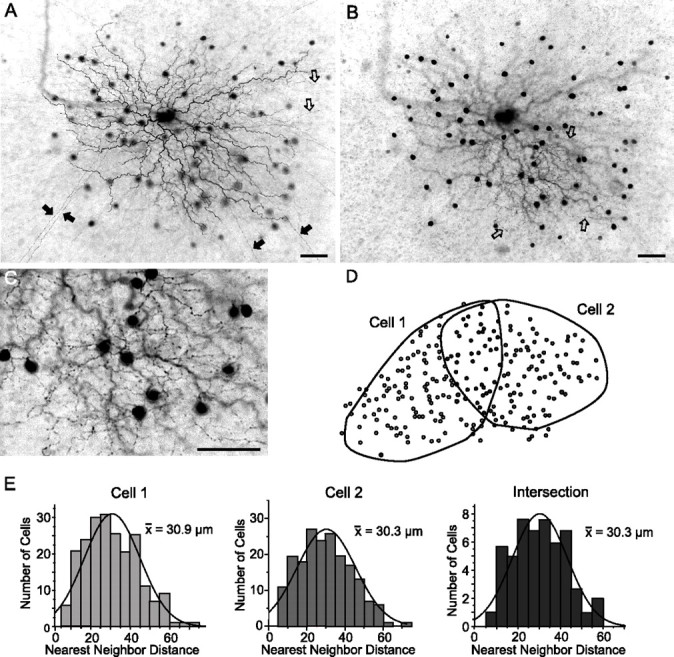
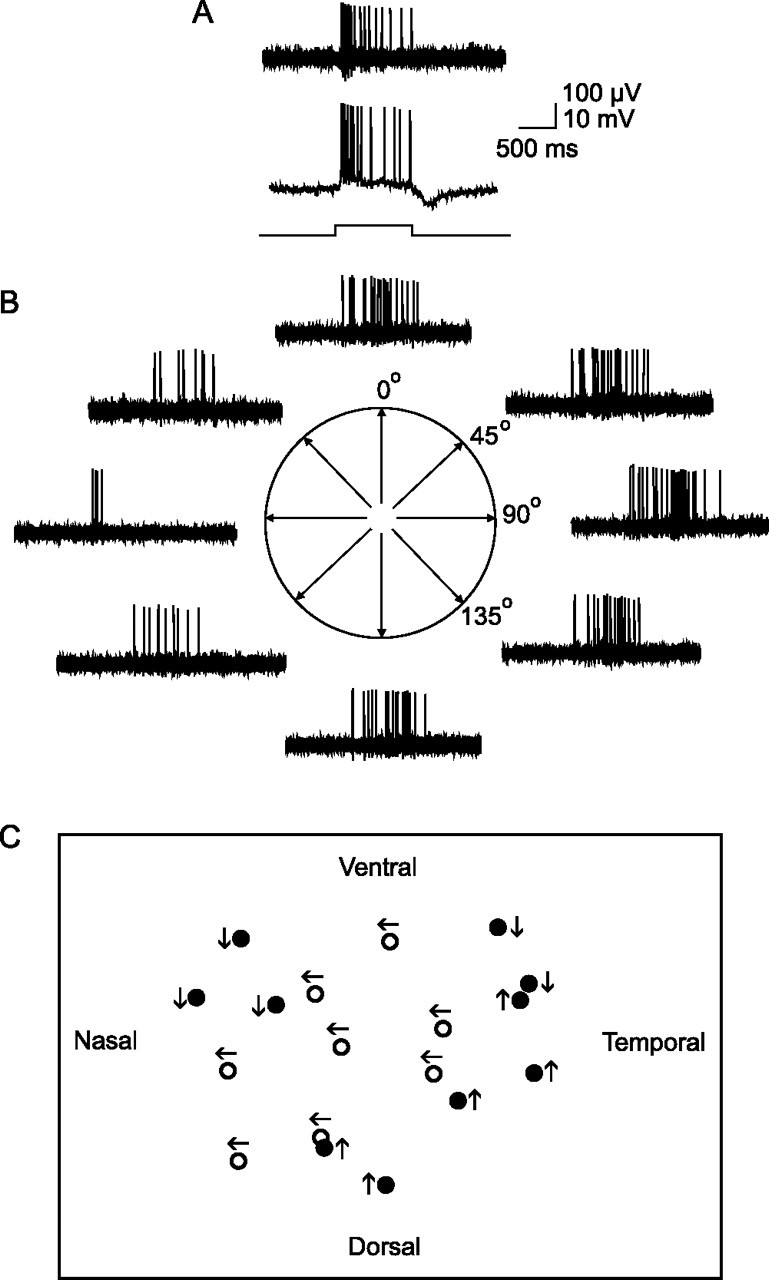
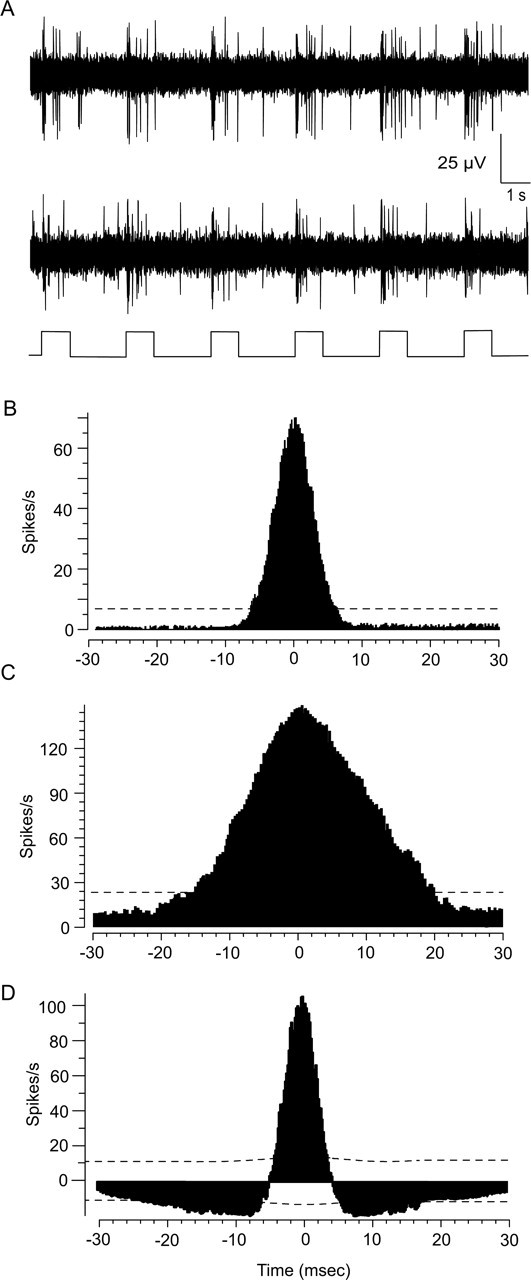
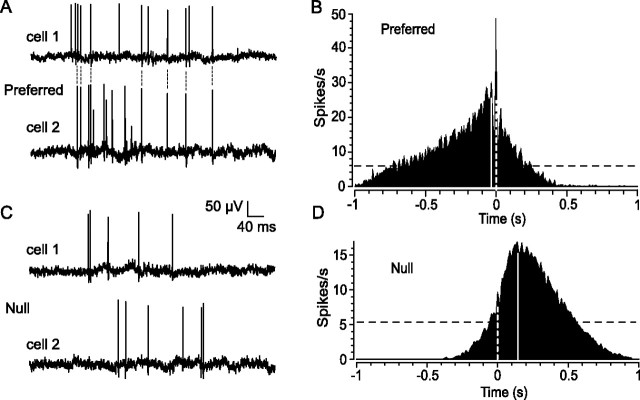
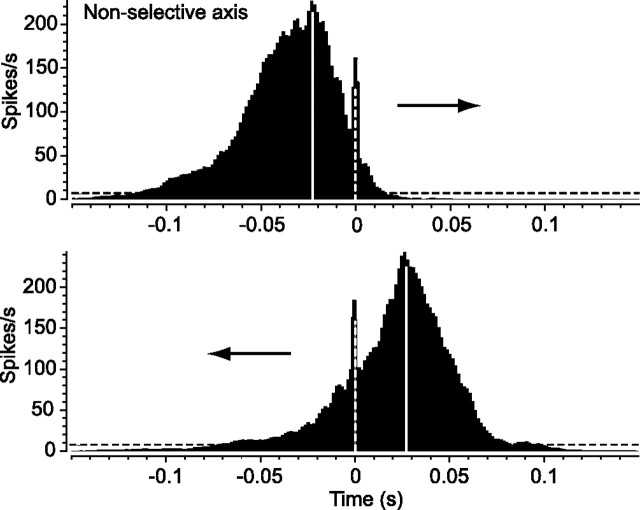
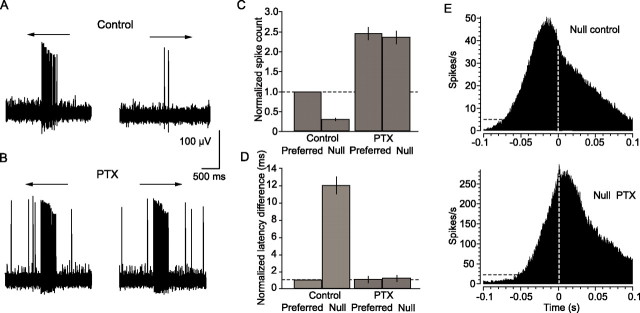
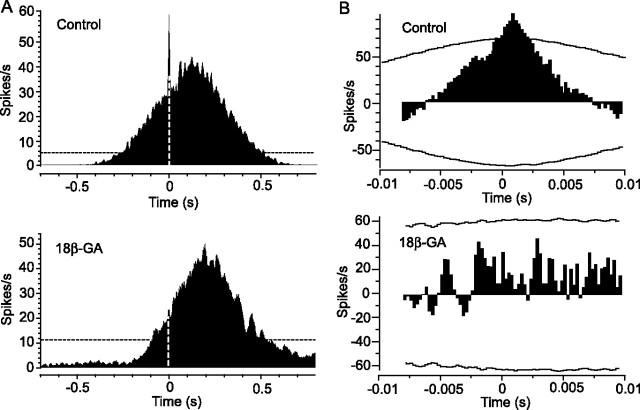
Although electrical coupling via gap junctions is prevalent among ganglion cells in the vertebrate retina, there have been few direct studies of their influence on the light-evoked signaling of these cells. Here, we describe the pattern and function of coupling between the ON direction selective (DS) ganglion cells, a unique subtype whose signals are transmitted to the accessory optic system (AOS) where they initiate the optokinetic response. ON DS cells are coupled indirectly via gap junctions made with a subtype of polyaxonal amacrine cell. This coupling underlies synchronization of the spontaneous and light-evoked spike activity of neighboring ON DS cells. However, we find that ON DS cell pairs show robust synchrony for all directions of stimulus movement, except for the null direction. Null stimulus movement evokes a GABAergic inhibition that temporally shifts firing of ON DS cell neighbors, resulting in a desynchronization of spike activity. Thus, detection of null stimulus movement appears key to the direction selectivity of ON DS cells, evoking both an attenuation of spike frequency and a desynchronization of neighbors. We posit that active desynchronization reduces summation of synaptic potentials at target AOS cells and thus provides a secondary mechanism by which ON DS cell ensembles can signal direction of stimulus motion to the brain.


Figures

Figure 1.
Figure 1.
Crescent-shaped ganglion cells form a regular mosaic that can be easily targeted for recording and labeling. A, Digital video image of the living flattened retinal–scleral preparation during an experiment. Ganglion cells with relatively large somata are easily visualized after Azure B labeling, including the α cells (open arrow). The crescent-shaped cells can be easily identified by their characteristic labeling pattern (closed arrow). Scale bar, 50 μm. B, Digital video image showing an array of crescent ganglion cells (circled) in the visual streak region. Scale bar, 50 μm. C, Histogram of nearest-neighbor distances between the somata of crescent ganglion cells within the visual streak region. The solid line is a Gaussian fit to the data. The average distance between crescent cells in the visual streak was 150 μm. D, Photomicrograph showing the complete morphology of a crescent cell labeled with Neurobiotin at an eccentricity of 1.8 mm from the optic disk. This cell shows a stereotypic asymmetric dendritic field and coupling to an array of amacrine cells that exhibit relatively small somata. Long axon-like processes of the amacrine cells can be seen extending beyond the field of view. Scale bar, 50 μm. E, Camera lucida drawings of Neurobiotin-labeled crescent cells showing variation in morphology with eccentricity. Cell eccentricities were 2.2 and 3.2 mm, respectively, from the optic disk. The arrows indicate an axon. Scale bar, 50 μm.
Figure 2.
Figure 2.
Crescent-shaped ganglion cells are coupled to polyaxonal amacrine cells. A, Neurobiotin-labeled crescent ganglion cell and tracer-coupled amacrine cells. Long, straight axon-like processes can be seen extending beyond the field of view (filled arrows). In addition, the amacrine cells maintain more curvy processes that end proximally (open arrows). Scale bar, 25 μm. B, Plane of focus at the distal edge of the IPL, showing the processes emerging from the tracer-coupled amacrine cell somata. These relatively thick, undulating, and varicose processes (open arrows) are quite different from the long axon-like processes illustrated in A. These morphological features indicate that the amacrine cells are polyaxonal cells with dendritic and axonal systems. Scale bar, 25 μm. C, Higher magnification view of amacrine cell dendritic processes illustrated in B. Scale bar, 25 μm. D, Schematic showing the outline of the dendritic arbors of two neighboring crescent ganglion cells, each of which was labeled with Neurobiotin. The shaded circles indicate the somata of the tracer-coupled polyaxonal amacrine cells. E, Histograms illustrating the nearest-neighbor distributions of the amacrine cell somata laying within the independent dendritic zones of the two ganglion cells and within the intersecting area. The Gaussian curves (solid lines) fit to the three data sets were identical. These data indicate that neighboring crescent ganglion cells are coupled to a common cohort of amacrine cells.
Figure 3.
Figure 3.
Crescent-shaped ganglion cells are ON direction selective cells. A, At the top is a sample extracellular recording from a crescent-shaped ganglion cell. This cell shows a transient burst of spikes at stimulus onset followed by a sustained component during stimulus presentation indicating on-center receptive field physiology. The bar at the bottom indicates onset and offset of full-field stimulus. Below is an intracellular recording from the same crescent-shaped cell showing the evoked spiking and slow potentials. This cell shows a hyperpolarizing component at light offset characteristic of crescent-shaped ganglion cells. B, Response of the cell to a 50-μm-wide slit of light swept back and forth across the retina along four different orientations. The cell is direction selective for temporal to nasal (rightward) movement along the horizontal axis. C, Schematic showing the direction preference for a cluster of ON DS cells. The cells in middle of the cluster (open circles) show the same temporal to nasal preference. Cells at the edges show different preferences (dark circles) but show neighbors with the same preference as well. These data suggest that DS ganglion cells with the same direction preference tend to form overlapping clusters with cells with different preferences.
Figure 4.
Figure 4.
Cross-correlation functions for spontaneous and light-evoked spiking of neighboring ON DS ganglion cells. A, Light-evoked responses of two ON DS ganglion cells recorded simultaneously. The trace at the bottom of the panel indicates the onset and offset of the full-field stimuli. B, Cross-correlogram of the spontaneous activity between a neighboring pair of ON DS cells recorded simultaneously. Distribution shows a narrow profile with peak at time 0. The dashed line is the 99% confidence limit. C, Cross-correlogram of the light-evoked spikes of the same cell pair in response to a stationary full-field stimulus. Distribution also shows a single peak at time 0, but is broader than that for spontaneous spikes. D, Shift predictor analysis of the light-evoked spikes shown in C eliminates correlations attributable to the light stimulus. After analysis, the profile still maintains a single peak at time 0, but is narrower, closely matching the cross-correlogram for spontaneous spikes. These data suggest that light-evoked concerted spiking is reflected by the broader profile component, whereas light-independent spike synchrony is reflected by the narrow component.
Figure 5.
Figure 5.
Direction of stimulus movement affects spike synchrony and onset latency between pairs of neighboring ON DS ganglion cells. A, Simultaneous extracellular recordings from a pair of ON DS cells in response to slit movement in the preferred direction. A significant number of spikes are synchronized as indicated by the connecting dotted lines. B, The spike synchrony is reflected in the cross-correlogram by the prominent peak at time 0 (white dashed line) lying within a broader profile. The broad component shows a peak displaced from time 0 (solid line) because of the fact that the slit entered the receptive field of one cell before the other. The dark dashed line is the 99% confidence limit. C, In contrast, spiking in response to slit movement in the null direction is desynchronized. In addition, null stimulation dramatically increases the spike onset latency difference between the two cells in comparison with that seen for preferred stimulus movement in A. D, The desynchronization of spiking during null stimulation is evidenced in the cross-correlogram by an almost complete loss of the peak at time 0. The increased difference in onset latency is reflected by a shift in the peak of the broad profile (solid line) from time 0 (dashed line) when compared with that seen in B for preferred stimulation.
Figure 6.
Figure 6.
Spike synchrony and spike onset latency are not affected by direction of stimulus movement along the nonselective axis. Cross-correlograms for spiking of neighboring pair of ON DS cells to the back-and-forth movement of the slit of light along the nonselective axis (orthogonal to the preferred/null axis). In contrast to slit movement along the preferred/null axis, the direction of movement along the orthogonal axis did not affect spike synchrony, as indicated by no change in the peak at time 0 (dashed white line).
Figure 7.
Figure 7.
GABAergic inhibition underlies the increased spike onset latency and desynchronization associated with stimulus movement in the null direction. A, Extracellularly recorded response of an ON DS cell to slit movement in the preferred and null directions. B, Application of 50 μm PTX increases the firing rate of the ON DS cell and abolishes its direction selectivity. C, Histogram comparing average normalized spike count in response to stimulus movement in the preferred and null directions before and after application of PTX. Data are from 10 cell pairs. PTX clearly abolishes direction selectivity. The vertical lines indicate SE. D, Histogram comparing the spike onset latency difference in response to preferred and null direction slit movement before and after PTX application. Under control conditions, null stimulation brings about a ∼12-fold increase in onset latency difference in comparison with that for preferred stimulus movement. Application of PTX abolishes this increase, thereby equalizing the onset latency difference in responses to both preferred and null stimulation. E, Cross-correlogram for light-evoked spikes of ON DS cell pair in response to slit movement in the null direction under control conditions (top). There is minimal spike synchrony, as evidenced by the lack of a prominent peak at time 0 (dashed white line). However, application of PTX increases synchrony, as evidenced by the peak at time 0 (bottom). Application of PTX caused an increase in firing; note the different scale of the ordinate axes in the top and bottom panels.
Figure 8.
Figure 8.
Disruption of gap junctions reduces spike synchrony between ON DS cell pairs. A, At the top is a cross-correlogram of light-evoked spikes of a pair of neighboring ON DS cells in response to slit movement in the preferred direction. Spike synchrony is indicated by the prominent peak at time 0 (dashed white line). Disruption of gap junctions by application of 25 μm 18β-GA abolishes the peak at time 0, indicating a desynchronization of cell spiking (bottom). The dashed black line is the 99% confidence interval. B, At the top is a cross-correlogram of the light-evoked spikes of an ON DS cell pair to full-field illumination after a shift predictor analysis. The horizontal curved lines indicate the 99% confidence limit. The peak at time 0 indicates spike synchrony independent of the light stimulus. At the bottom is the cross-correlogram generated after application of 18β-GA. Spike synchrony is eliminated by disruption of the gap junctions.

References

    1. Alonso JM, Usrey WM, Reid RC (1996). Precisely correlated firing in cells of the lateral geniculate nucleus. Nature 383:815–819. - PubMed
    1. Amthor FR, Takahashi ES, Oyster CW (1989). Morphologies of rabbit retinal ganglion cells with complex receptive fields. J Comp Neurol 280:97–121. - PubMed
    1. Arnett D, Spraker TE (1981). Cross-correlation analysis of the maintained discharge of rabbit retinal ganglion cells. J Physiol (Lond) 317:29–47. - PMC - PubMed
    1. Barlow HB, Hill RM, Levick WR (1964). Retinal ganglion cells responding selectively to direction and speed of image motion in the rabbit. J Physiol (Lond) 173:377–407. - PMC - PubMed
    1. Beyer EC, Paul DL, Goodenough DA (1990). Connexin family of gap junction proteins. J Membr Biol 116:87–194. - PubMed

Publication types