Comparative Study
. 2006 Apr 19;26(16):4338-49.
doi: 10.1523/JNEUROSCI.3745-05.2006.

Barrel map development relies on protein kinase A regulatory subunit II beta-mediated cAMP signaling

Affiliations
Comparative Study

Barrel map development relies on protein kinase A regulatory subunit II beta-mediated cAMP signaling

Melis Inan et al. J Neurosci. .

Abstract

The cellular and molecular mechanisms mediating the activity-dependent development of brain circuitry are still incompletely understood. Here, we examine the role of cAMP-dependent protein kinase [protein kinase A (PKA)] signaling in cortical development and plasticity, focusing on its role in thalamocortical synapse and barrel map development. We provide direct evidence that PKA activity mediates barrel map formation using knock-out mice that lack type IIbeta regulatory subunits of PKA (PKARIIbeta). We show that PKARIIbeta-mediated PKA function is required for proper dendritogenesis and the organization of cortical layer IV neurons into barrels, but not for the development and plasticity of thalamocortical afferent clustering into a barrel pattern. We localize PKARIIbeta function to postsynaptic processes in barrel cortex and show that postsynaptic PKA targets, but not presynaptic PKA targets, have decreased phosphorylation in pkar2b knock-out (PKARIIbeta(-/-)) mice. We also show that long-term potentiation at TC synapses and the associated developmental increase in AMPA receptor function at these synapses, which normally occurs as barrels form, is absent in PKARIIbeta(-/-) mice. Together, these experiments support an activity-dependent model for barrel map development in which the selective addition and elimination of thalamocortical synapses based on Hebbian mechanisms for synapse formation is mediated by a cAMP/PKA-dependent pathway that relies on PKARIIbeta function.


Figures

Figure 1.
Figure 1.
Reduced PKA activity in somatosensory cortex of PKARIIβ−/− mice. A, The ratio of PKA activity measured in the presence (+cAMP) and absence (basal) of cAMP is significantly reduced in P11 somatosensory cortex of PKARIIβ−/− (KO) mice compared with wild-type (WT) controls (histograms on left; *p < 0.005, t test). PKA activity was measured in tissue homogenates from somatosensory cortex using a protein kinase assay kit (Promega). PKAC protein levels are also significantly reduced in PKARIIβ−/− compared with wild-type littermate control mice (histograms on right; *p ≪ 0.01, t test). B, Example Western blots of synaptosomes prepared from P11 somatosensory cortex of PKARIIβ−/− mice and their wild-type littermate controls using anti-PKARIIβ and anti-PKAC antibodies. Actin is used to normalize the protein amount. As expected, PKARIIβ−/− mice have no PKARIIβ expression. Error bars show SEM.
Figure 2.
Figure 2.
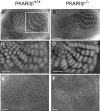
Organization of layer IV neurons but not thalamocortical axon clustering is disrupted in PKARIIβ−/− mice. A, B, Tangential sections from P16 wild-type (A) and PKARIIβ−/− (B) mice stained with CO (n = 6 for both genotypes). Posteromedial whisker barrel patterns (white box in A) are indistinguishable between genotypes. C, D, Tangential sections from P7 wild-type (C) and PKARIIβ−/− (D) mice immunostained with anti-5-HTT antibody (n = 4 for both genotypes), which selectively labels thalamocortical afferents. The barrel pattern is again indistinguishable between genotypes, showing that the gross patterning of thalamocortical afferents in PKARIIβ−/− mice is similar to that of wild types. E, F, Nissl stained tangential sections from P16 wild-type (E) and PKARIIβ−/− (F) mice. In wild-type mice (E), layer IV neurons organize into a barrel wall and hollow pattern characteristic of rodent somatosensory cortex. In PKARIIβ−/− mice (F), only a very rudimentary barrel pattern is visible in posteromedial barrel field. Quantification confirms that the density of neurons in the barrel wall relative to the barrel hollow is significantly higher in wild-type mice than in PKARIIβ−/− littermate mice (1.76 ± 0.05 in n = 4 wild-type mice; 0.93 ± 0.05 in n = 4 PKARIIβ−/− mice; p < 0.001, t test). Scale bars, 500 μm.
Figure 3.
Figure 3.
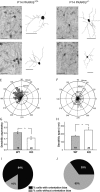
Layer IV spiny stellate neurons in PKARIIβ−/− mice have less orientation bias than wild-type littermate controls. A–D, Examples of Golgi-stained layer IV spiny stellate neurons at low magnification (left) and their computer-aided reconstructions (right) in wild-type (A, B) and PKARIIβ−/− (C, D) mice at P14. E, F, Polar graphs of the dendrites of neurons illustrated in B and D (see Materials and Methods). G, PKARIIβ−/− (KO) mice (0.71 ± 0.02; 20 neurons from 4 animals) have significantly lower (*p < 0.01; t test) dendritic asymmetry compared with wild-type (WT) littermate controls (0.81 ± 0.02; 19 neurons from 4 animals). Dendritic asymmetry, which must be ≥0.5, is defined as the ratio of the dendritic length in the hemisphere with the greatest density of dendrites relative to the total dendritic length. H, Dendritic field span, the greatest distance between the most distal dendrite tips of a particular layer IV spiny stellate neuron, is significantly higher (*p < 0.05; t test) in PKARIIβ−/− (KO) mice (249.43 ± 31.77 μm) compared with wild-type (WT) littermate controls (174.24 ± 11.96 μm). I, J, Pie charts showing the percentage of cells with and without orientation bias in PKARIIβ−/− (J) and wild-type littermate control mice (I). Layer IV spiny stellate neurons are defined to have an orientation bias if their dendritic asymmetry is ≥0.75 (see Materials and Methods). Scale bar, 50 μm. Error bars indicate SEM.
Figure 4.
Figure 4.
PKARIIβ is extensively colocalized with postsynaptic but not presynaptic markers. A, Control immunostaining of a P5 PKARIIβ−/− thalamocortical slice with anti-PKARIIβ antibody reveals that this antibody is specific to PKARIIβ. B, C, Cortical expression of PKARIIβ was examined by labeling wild-type thalamocortical (B) and tangential (C) slices with anti-PKARIIβ antibody. PKARIIβ is expressed in layer IV as it delaminates from layer II/III at P3 (data not shown) and forms a barrel pattern when barrels emerge at around P5 (B, C). D–I, Presynaptic and postsynaptic localization of PKARIIβ was examined by coimmunostaining P5 wild-type thalamocortical slices using anti-5-HTT (D–F) and anti-MAP2 (G–I) antibodies, respectively, together with an anti-PKARIIβ antibody. D, Low-magnification image of a single barrel stained with a 5-HTT antibody (green) to label presynaptic thalamocortical terminals and a PKARIIβ (red) antibody and their merged image. At low magnification, both show a clear barrel pattern. E, Merged image of the barrel in D (white box) at 63× magnification. F, A 4× zoom of white-boxed area in E. G, Low-magnification image of a single barrel labeled with a MAP2 antibody (green) to mark postsynaptic dendrites and a PKARIIβ antibody (red) and their merged image. H, Merged image of the barrel in G (white box) at 63× magnification. I, 4× zoom of white-boxed area in H. Colocalization analysis of high-magnification images using ImageJ shows that PKARIIβ expression colocalizes significantly more (p < 0.05; t test) with MAP2 (28.8 ± 7.5%; n = 4) than with 5-HTT (7.1 ± 2.2%; n = 4). LIV, Layer IV; LV, layer V. Scale bars: A–C, 500 μm; D, G, 100 μm; E, H, 40 μm; F, I, 10 μm.
Figure 5.
Figure 5.
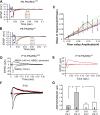
Developmental increase in AMPAR/NMDAR current ratio is absent in PKARIIβ−/− mice. A–C, Input–output analyses of extracellular field potential recordings indicate no difference in gross synaptic transmission between wild-type and PKARIIβ−/− thalamocortical synapses. A, B, Sample average responses at different stimulation strengths of P6 wild-type and PKARIIβ−/− mice. The arrowhead shows the fiber volley, and the arrow shows the postsynaptic response. C, Input–output curves in wild-type (black; n = 8) and PKARIIβ−/− (red; n = 4) mice at P6–P7 are similar. Regression analysis for wild types (green) and PKARIIβ−/− (blue) show no significant difference at 95% confidence interval (dashed lines overlap). D–F, Sample whole-cell voltage-clamp measurements of AMPAR-mediated and NMDAR-mediated thalamocortical EPSCs in a P10 wild-type littermate control (D) and P10 PKARIIβ−/− (E) mouse. F, Overlay of the responses in D and E scaled so that the NMDAR currents are the same amplitude. Note the AMPAR-mediated EPSC in PKARIIβ−/− animal is small in comparison to the littermate control. G, Summary quantification of AMPAR/NMDAR current ratios for different age groups and different genotypes. The AMPAR/NMDAR current ratio of wild-type animals increases significantly with age (*p < 0.05; t test). However, this increase is absent in PKARIIβ−/− (KO) mice (p = 0.27; t test). The AMPAR/NMDAR current ratio of P9–P11 PKARIIβ−/− mice is also significantly lower than that of P9–P11 wild-type (WT) littermate controls (*p < 0.05; t test). Error bars indicate SEM.
Figure 6.
Figure 6.
Small AMPAR mini-EPSCs at PKARIIβ−/− thalamocortical synapses. A, B, Sample traces of evoked AMPAR-mediated current responses in Ca2+–ACSF (gray) and Sr2+–ACSF (black) from recordings in P9–P11 PKARIIβ−/− (B) and wild-type littermate control (A) neurons. In the presence of Sr2+–ACSF, responses to evoked synchronous release is lower and quantal events (evoked mini-EPSCs) in response to asynchronous release appear. The amplitudes of these quantal events are smaller on average in PKARIIβ−/− mice. C, Average frequency histogram of evoked mini-EPSCs. The PKARIIβ−/− histogram (white bars) peaks at a smaller amplitude than wild-type littermate controls (gray bars), which have a longer large amplitude tail. Inset, Mean evoked mini-EPSC amplitude is significantly lower (*p < 0.05; t test) for PKARIIβ−/− mice (white) with respect to wild-type littermate controls (gray). D, The cumulative probability distribution in PKARIIβ−/− (KO) animals (black) also shows a shift toward smaller amplitudes compared with wild-type (WT) littermate controls (gray). Comparison of root mean square noise shows no difference (p = 0.45; t test) between genotypes (data not shown). Error bars indicate SEM.
Figure 7.
Figure 7.
LTP deficits in PKARIIβ−/− thalamocortical synapses. A, B, Example whole-cell voltage-clamp recordings from P6 wild-type control (A) and PKARIIβ−/− (B) neurons show that thalamocortical response in wild-type but not PKARIIβ−/− layer IV neurons can be potentiated using an LTP pairing protocol. Traces on the right (average of 20 sweeps) from before (1) and 30 min after pairing (2) show significant potentiation in wild-type but not PKARIIβ−/− neurons. C, Summary graph of pairing experiments showing the EPSC percentage change for PKARIIβ−/− mice (black circles) and their wild-type littermate controls (gray circles). PKARIIβ−/− thalamocortical synapses show no sign of potentiation. D, Summary histogram of EPSC percentage change from the average of 20 sweeps starting at 20 min after pairing for all neurons. PKARIIβ−/− (KO) thalamocortical synapses show almost no potentiation (1.59 ± 6.92%; n = 5), and their EPSC percentage change is significantly lower (*p < 0.05; t test) than that of wild-type (WT) littermate controls (122.96 ± 41.04%; n = 7). Error bars indicate SEM.
Figure 8.
Figure 8.
PKARIIβ−/− mice have a significant reduction in phosphorylation of postsynaptic but not presynaptic PKA targets. A, Western blot examples of synaptosomes prepared from P11 somatosensory cortex of PKARIIβ−/− mice and their littermate controls using antibodies against PKA phosphorylation targets. B, Quantification of normalized ratio of anti-phospho GluR1 (PGluR1, Ser845) to total GluR1 and anti-phospho NR1 (PNR1, Ser 897) to total NR1 reveals a significant difference between PKARIIβ−/− (KO) and wild-type (WT) littermate control mice (*p < 0.005 for both; t test). None of the presynaptic PKA phosphorylation targets such as phospho-synapsin (p = 0.26; t test) and phospho-Rim (p = 0.56; t test) reveal a difference between PKARIIβ−/− mice and their wild-type littermate controls (data not shown). Quantification of the band labeled with an anti-phospho-MAPK (PMAPK) antibody, which recognizes both p44 (top band in A) and p42 (bottom band in A) phosphorylation of MAPK (or ERK), also shows no difference (data not shown; p = 0.51; t test). Error bars indicate SEM.
Figure 9.
Figure 9.
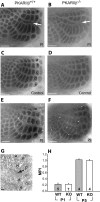
TCA barrel map plasticity is normal in PKARIIβ−/− mice. A, B, CO staining of tangential sections from barrel cortex shows that C-row whisker cauterization at P1 induced robust map plasticity in TCAs of both PKARIIβ−/− mice (B) and their littermate controls (A). C, D, Barrel cortex of control hemispheres where corresponding whiskers were left intact show a normal barrel pattern. E, F, Map plasticity critical period ends by P5 for both PKARIIβ−/− (F) and wild-type control mice (E). G, H&E staining of the cauterized whisker pad confirms that the cauterizations were limited to the C row of whiskers. H, Summary quantification of barrel map plasticity measured with an MPI (see Materials and Methods). CO barrel map plasticity is significant for wild-type littermate control and PKARIIβ−/− (KO) mice at P1 (p ≪ 0.001; t test) compared with control hemispheres (data not shown). However, comparison of MPIs for PKARIIβ−/− mice and wild-type (WT) littermate controls show no significant difference neither at P1 (p = 0.93; t test) nor at P5 (p = 0.57; t test). Scale bars, 500 μm. Error bars indicate SEM.

Similar articles

Cited by

References

    1. Abdel-Majid RM, Leong WL, Schalkwyk LC, Smallman DS, Wong ST, Storm DR, Fine A, Dobson MJ, Guernsey DL, Neumann PE (1998). Loss of adenylyl cyclase I activity disrupts patterning of mouse somatosensory cortex. Nat Genet 19:289–291. - PubMed
    1. Amieux PS, Cummings DE, Motamed K, Brandon EP, Wailes LA, Le K, Idzerda RL, McKnight GS (1997). Compensatory regulation of RIalpha protein levels in protein kinase A mutant mice. J Biol Chem 272:3993–3998. - PubMed
    1. Banke TG, Bowie D, Lee H, Huganir RL, Schousboe A, Traynelis SF (2000). Control of GluR1 AMPA receptor function by cAMP-dependent protein kinase. J Neurosci 20:89–102. - PMC - PubMed
    1. Bauman AL, Goehring AS, Scott JD (2004). Orchestration of synaptic plasticity through AKAP signaling complexes. Neuropharmacology 46:299–310. - PubMed
    1. Beaver CJ, Ji Q, Fischer QS, Daw NW (2001). Cyclic AMP-dependent protein kinase mediates ocular dominance shifts in cat visual cortex. Nat Neurosci 4:159–163. - PubMed

Publication types

MeSH terms

Substances

LinkOut - more resources