

Variable selection for propensity score models
- PMID: 16624967
- PMCID: PMC1513192
- DOI: 10.1093/aje/kwj149
Variable selection for propensity score models
Abstract
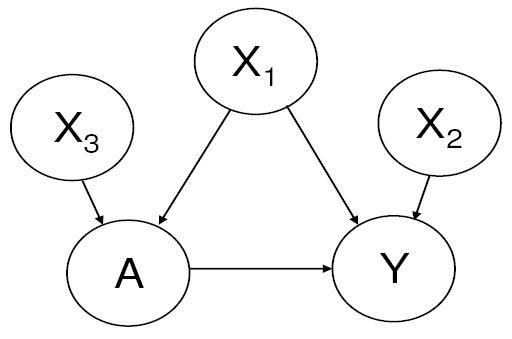
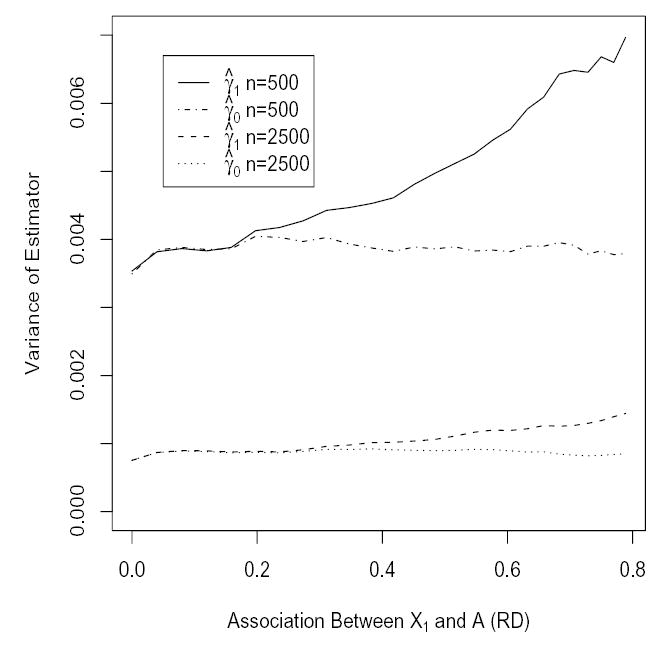
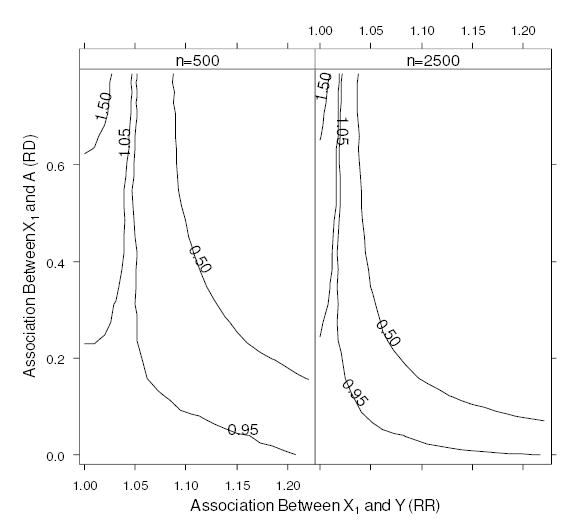
Despite the growing popularity of propensity score (PS) methods in epidemiology, relatively little has been written in the epidemiologic literature about the problem of variable selection for PS models. The authors present the results of two simulation studies designed to help epidemiologists gain insight into the variable selection problem in a PS analysis. The simulation studies illustrate how the choice of variables that are included in a PS model can affect the bias, variance, and mean squared error of an estimated exposure effect. The results suggest that variables that are unrelated to the exposure but related to the outcome should always be included in a PS model. The inclusion of these variables will decrease the variance of an estimated exposure effect without increasing bias. In contrast, including variables that are related to the exposure but not to the outcome will increase the variance of the estimated exposure effect without decreasing bias. In very small studies, the inclusion of variables that are strongly related to the exposure but only weakly related to the outcome can be detrimental to an estimate in a mean squared error sense. The addition of these variables removes only a small amount of bias but can increase the variance of the estimated exposure effect. These simulation studies and other analytical results suggest that standard model-building tools designed to create good predictive models of the exposure will not always lead to optimal PS models, particularly in small studies.
Figures
Comment in
-
Re: "Variable selection for propensity score models".Am J Epidemiol. 2007 Jul 15;166(2):238-9. doi: 10.1093/aje/kwm164. Epub 2007 May 25. Am J Epidemiol. 2007. PMID: 17526863 No abstract available.
References
-
- Rosenbaum PR, Rubin DB. The central role of the propensity score in observational studies for causal effects. Biometrika. 1983;79:516–524.
-
- Rubin DB, Thomas N. Matching using estimated propensity score: relating theory to practice. Biometrics. 1996;52:249–264. - PubMed
-
- Rubin DB. Estimating causal effects from large data sets using the propensity score. Ann Intern Med. 1997;127:757–763. - PubMed
-
- Perkins SM, Tu W, Underhill MG, Zhou XH, Murray MD. The use of propensity scores in pharmacoepidemiologic research. Phamacoepidemiolog Drug Saf. 2000;9:93–101. - PubMed
-
- Robins JM, Mark SD, Newey WK. Estimating exposure effects by modelling the expectation of exposure conditional on confounders. Biometrics. 1992;48:479–495. - PubMed
Publication types
MeSH terms
Grants and funding
LinkOut - more resources
Full Text Sources
Medical
