

doi: 10.1364/ol.31.001082.
Feasibility of diffuse optical imaging with long-lived luminescent probes
Affiliations
- PMID: 16625910
- PMCID: PMC2440656
- DOI: 10.1364/ol.31.001082
Item in Clipboard
Feasibility of diffuse optical imaging with long-lived luminescent probes
Opt Lett.
.
Abstract
Long-lived near-infrared phosphors with high quantum yields have recently become available, making it possible to image oxygen distributions in tissue in three dimensions. By numerical simulations we demonstrate that, by using phosphorescent probes with appropriate oxygen quenching constants, one can image hypoxic phantoms in scattering media with adequate spatial resolution, employing simple time-gated measurements. The approach developed will guide experimental imaging of phosphorescence lifetime and oxygen pressure in living tissue.
Figures
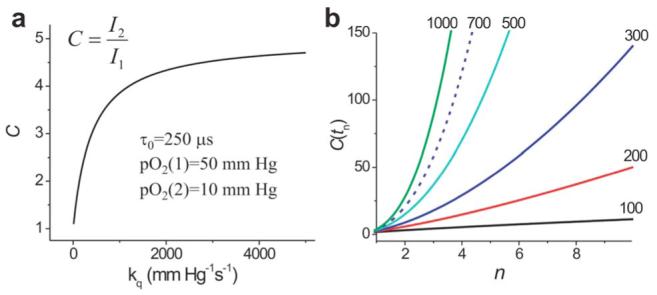
(Color online) a, Dependence of contrast C on kq for two equally excited volumes with continuous-wave excitation; b, dependence of contrast C(tn) on index n for which tn=τ2 ln(n); tn, start of data integration values of kq for the curves are given in units of mm Hg-1 s-1 (1mm Hg=1 Torr).
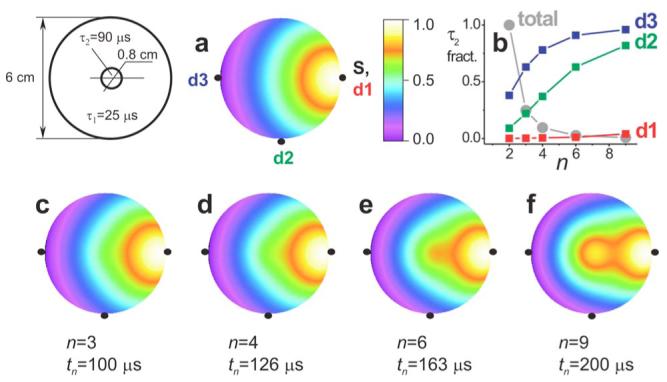
(Color online) a, Distribution of excitation density and c-f, individually normalized distributions of phosphorescence density (log scale) after delays tn in a two-dimensional object: μs=0.5 mm-1, μa=0.006 mm-1 (excitation), pO2=50 mm Hg (hypoxic region, pO2=10 mm Hg). b, Changes in fraction of the τ2 signal in detectors d1-d3 and relative changes in total photons (lighter shading).
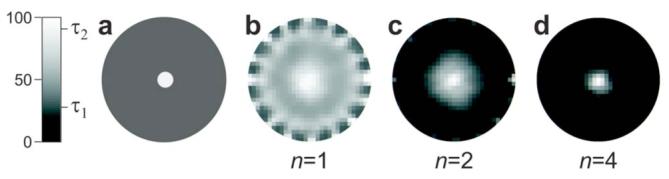
Images of a hypoxic phantom (τ2=90 μs), a,in a normoxic volume (τ1=25 μs; Fig. 2) and, b-d, reconstructed from boundary data acquired after delays tn=τ2 ln(n).
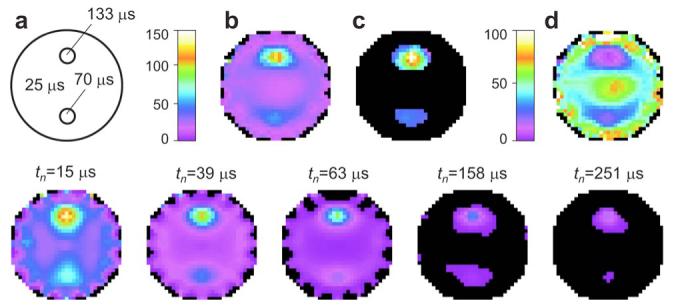
(Color online) a, Scattering object (Ø6cm, pO2=50 mm Hg) with two hypoxic regions: pO2=15 mm Hg (τ2=70 μs) and pO2=15mm Hg (τ3=133 μs). Lifetime images (microseconds), b, reconstructed from the whole sequence of intensity images (lower row) or, c, from the intensity images acquired at higher delays (tn>50 μs). d, Oxygen images (in millimeters of mercury) obtained from lifetime image. b, Bottom row, phosphorescence intensity images collected at difference delays tn and normalized by the maximal intensity in the first image (tn=15 μs). Same color scheme as for a-d.
References
-
- Hielscher AH. Curr. Opin. Biotechnol. 2005;16:79. and references therein. - PubMed
-
- Ntziachristos V, Tung C, Bremer C, Weissleder R. Nat. Med. (N.Y.) 2002;8:757. - PubMed
-
- Licha K. Top. Curr. Chem. 2002;222:1.
-
- Sevick-Muraca EM, Burch CL. Opt. Lett. 1994;19:1928. - PubMed
-
- Chen A, Sevic-Muraca EM. Proc. SPIE. 1997;2979:129.
Publication types
MeSH terms
Substances
Grants and funding
LinkOut - more resources
Full Text Sources
Other Literature Sources
