. 2006 Apr 20:5:17.
doi: 10.1186/1476-072X-5-17.

A GIS-driven integrated real-time surveillance pilot system for national West Nile virus dead bird surveillance in Canada

Affiliations

A GIS-driven integrated real-time surveillance pilot system for national West Nile virus dead bird surveillance in Canada

Jiangping Shuai et al. Int J Health Geogr. .

Abstract

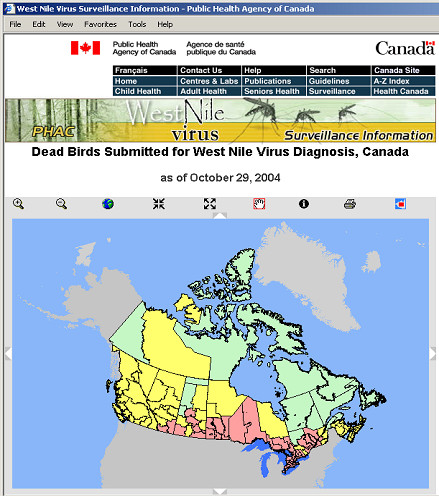
Background: An extensive West Nile virus surveillance program of dead birds, mosquitoes, horses, and human infection has been launched as a result of West Nile virus first being reported in Canada in 2001. Some desktop and web GIS have been applied to West Nile virus dead bird surveillance. There have been urgent needs for a comprehensive GIS services and real-time surveillance.

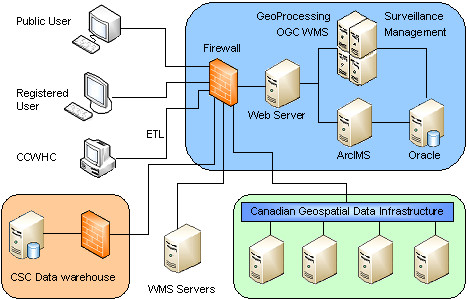
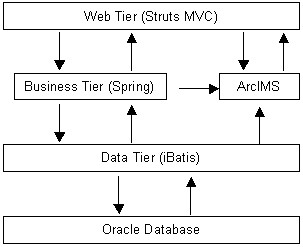
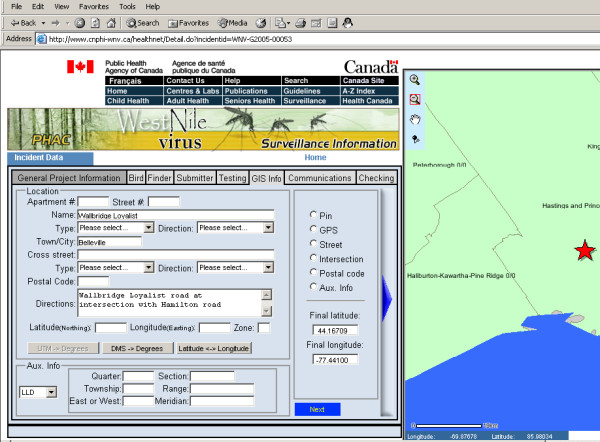
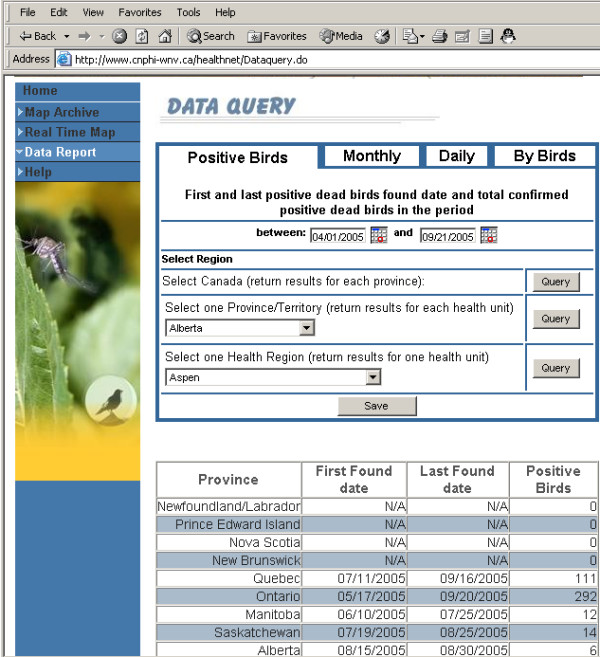
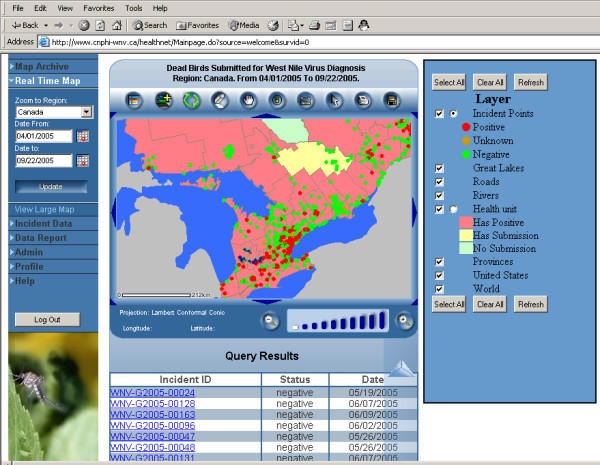
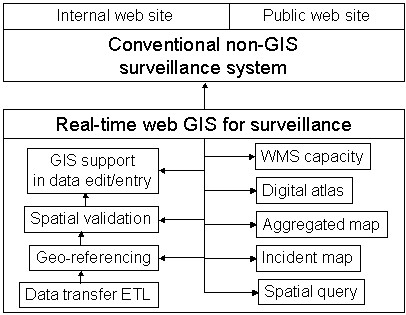
Results: A pilot system was developed to integrate real-time surveillance, real-time GIS, and Open GIS technology in order to enhance West Nile virus dead bird surveillance in Canada. Driven and linked by the newly developed real-time web GIS technology, this integrated real-time surveillance system includes conventional real-time web-based surveillance components, integrated real-time GIS components, and integrated Open GIS components. The pilot system identified the major GIS functions and capacities that may be important to public health surveillance. The six web GIS clients provide a wide range of GIS tools for public health surveillance. The pilot system has been serving Canadian national West Nile virus dead bird surveillance since 2005 and is adaptable to serve other disease surveillance.

Conclusion: This pilot system has streamlined, enriched and enhanced national West Nile virus dead bird surveillance in Canada, improved productivity, and reduced operation cost. Its real-time GIS technology, static map technology, WMS integration, and its integration with non-GIS real-time surveillance system made this pilot system unique in surveillance and public health GIS.


Figures

Figure 1
Figure 1
System structure. This pilot system allows both public and internal users to access different parts of the system. Data can be reported through Internal data reporting page, or by a standalone ETL tool if provinces already have surveillance reporting systems. This pilot system can access both open WMS and secure WMS.
Figure 2
Figure 2
System architecture. This pilot system uses Structs, Spring, iBatis as the frameworks for development. These frameworks have enhanced the system. It uses Oracle and ArcIMS to manage data and web GIS.
Figure 3
Figure 3
Internal data edit. This pilot system deals with over 100 fields for surveillance data reporting and editing. Specific functions have been developed to integrate GIS capacity and surveillance data reporting/editing. A map is present to assist spatial data element input and verification.
Figure 4
Figure 4
Data query. This pilot system provides four types of queries at three spatial levels. Users can query data at different period (including real-time data and historical data). Data can be saved as well.
Figure 5
Figure 5
Internal real-time map. The internal real-time map provides aggregated map at health unit level, bird location mapping, and OGC WMS maps. The legend allows users to query real-time data at health unit level and the bird points. Users can click the incident from the query result table and switch to data editing page.
Figure 6
Figure 6
Sample WMS map. This pilot system provides WMS and makes it publicly available. It can be accessed through standard OGC GetMap request (i.e. ).
Figure 7
Figure 7
Lightweight mapping client. This web mapping client provides an interactive mapping client that is much lighter than the out-of-box ArcIMS HTML viewer. This client does not use frame, therefore can be easily integrated into other web systems. This client is easy to customize, and has a good look-and-feel.
Figure 8
Figure 8
Enrichment and enhancement to conventional surveillance system. This pilot system developed a number of web GIS components to enrich and enhance conventional surveillance systems that do not have GIS components. These components provide new services such as digital atlas using static maps, real-time mapping, comprehensive geo-referencing, and WMS, spatial data validation.

References

    1. Public Health Agency of Canada West Nile virus – History. 2005. http://www.phac-aspc.gc.ca/wn-no/index_e.html
    1. Public Health Agency of Canada Human Results – 2005 Program: West Nile Virus Neurological Syndromes, West Nile Virus Non-Neurological Syndrome and West Nile Virus Asymptomatic Infection, Diagnosis by Health Region, Canada as of September 17, 2005. 2005. http://dsol-smed.phac-aspc.gc.ca/wnv3/map_e.phtml?appname=human
    1. Zohrabian A, Meltzer M, Ratard R, Billah K, Molinari NA, Roy K, Scott II RD, Petersen L. West Nile virus Economic Impact, Louisiana, 2002. Emerging Infectious Diseases. 2004;10:1736–1744. - PMC - PubMed
    1. Reisen W, Lothrop H, Chiles R, Madon M, Cossen C, Woods L, Husted S, Kramer V, Edman J. West Nile virus in California. Emerging Infectious Diseases. 2004;10:1369–1378. - PMC - PubMed
    1. British Columbia Centre for Disease Control Interactive GIS Mapping for West Nile Virus. 2006. http://maps.bccdc.org

Publication types