. 2006 Aug 1;574(Pt 3):677-98.
doi: 10.1113/jphysiol.2005.095661. Epub 2006 Apr 20.

Tmc1 is necessary for normal functional maturation and survival of inner and outer hair cells in the mouse cochlea

Affiliations

Tmc1 is necessary for normal functional maturation and survival of inner and outer hair cells in the mouse cochlea

Walter Marcotti et al. J Physiol. .

Abstract

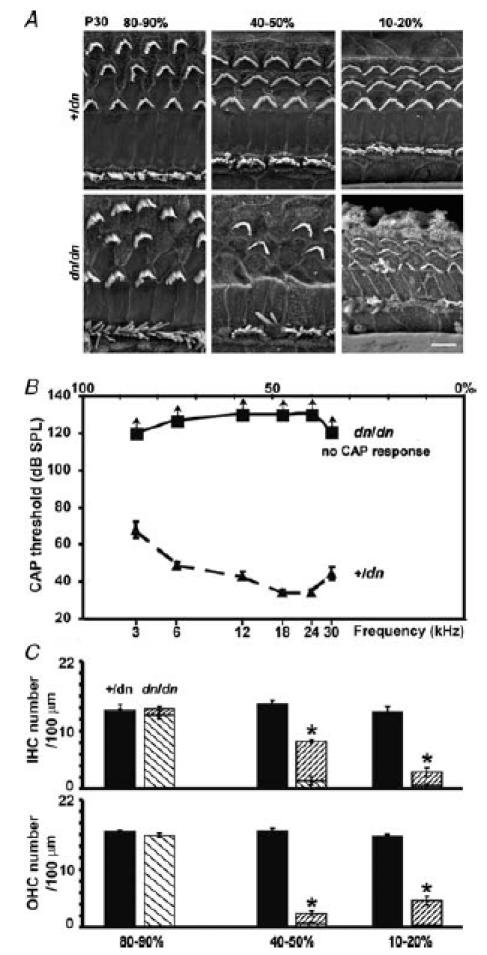
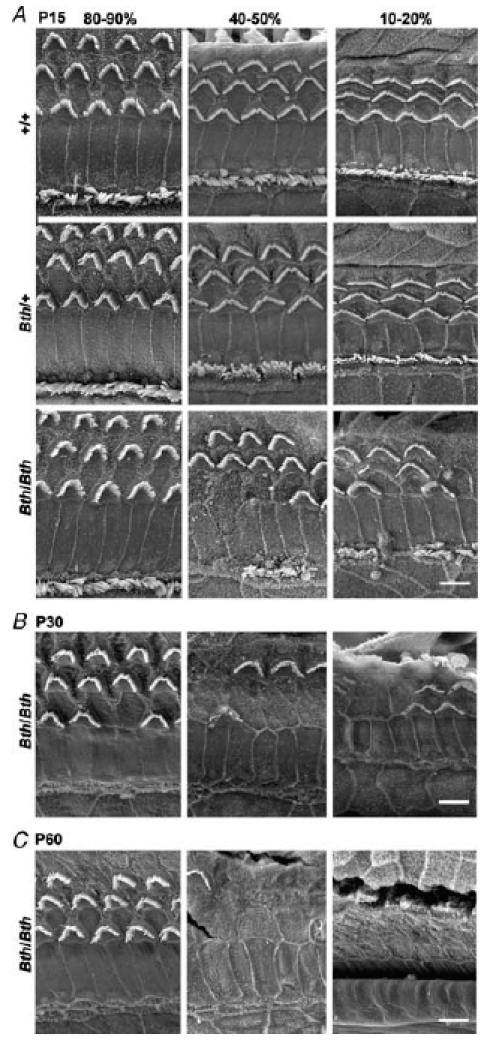
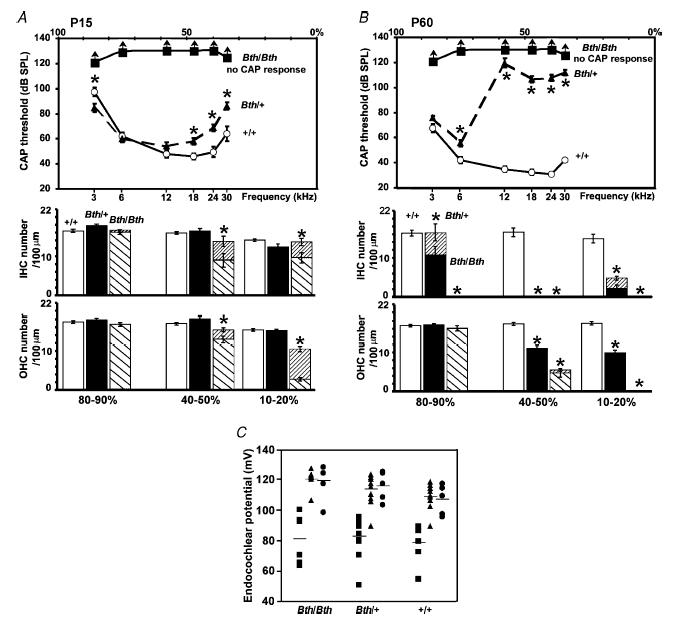
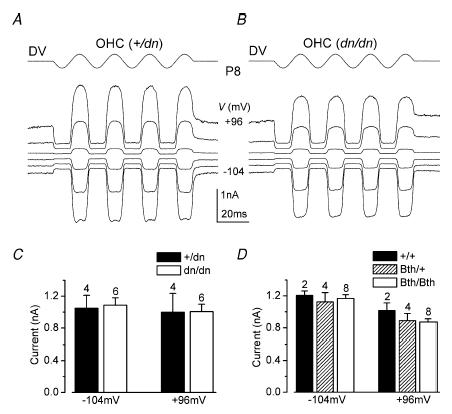
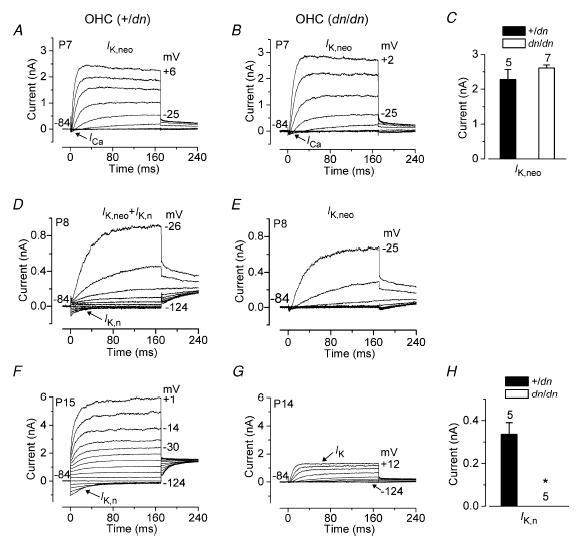
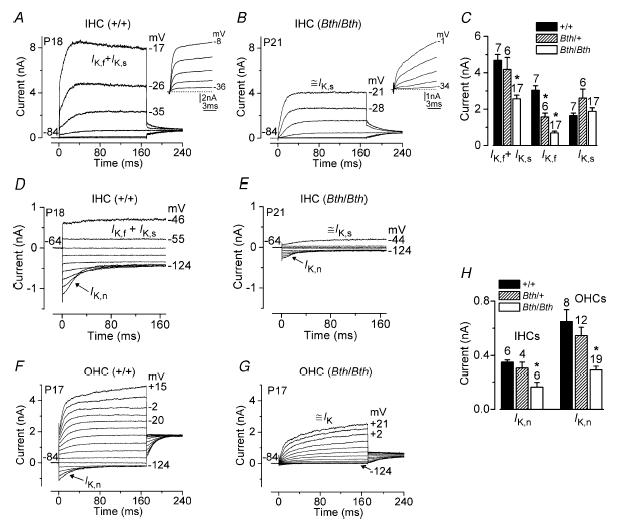
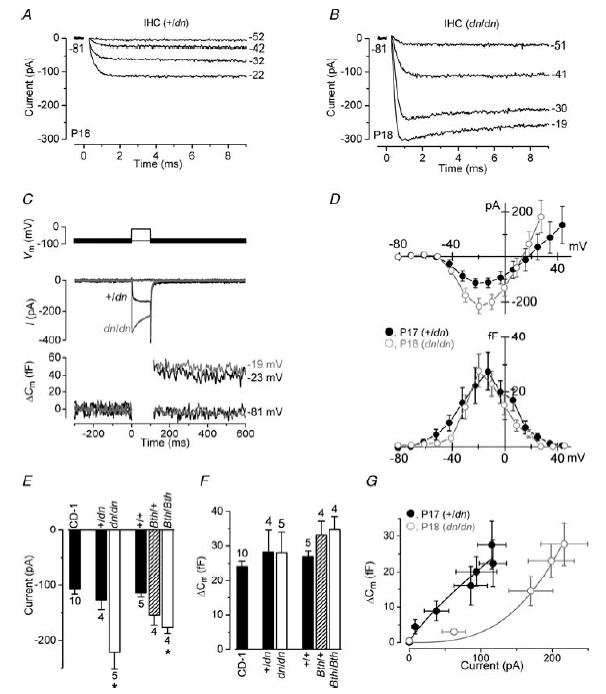
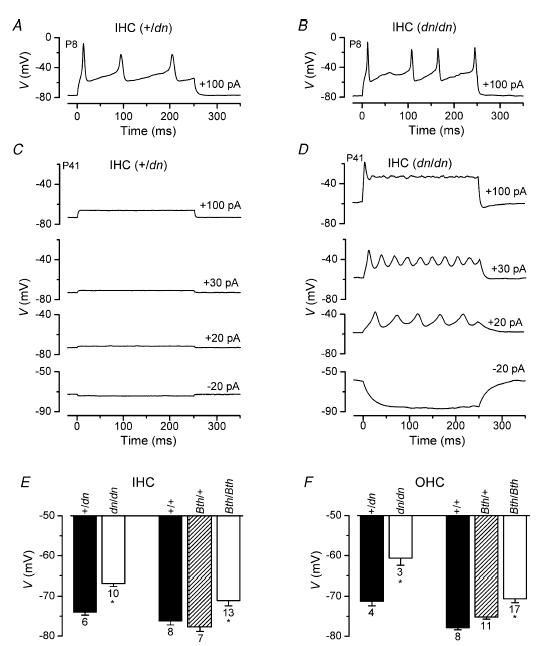
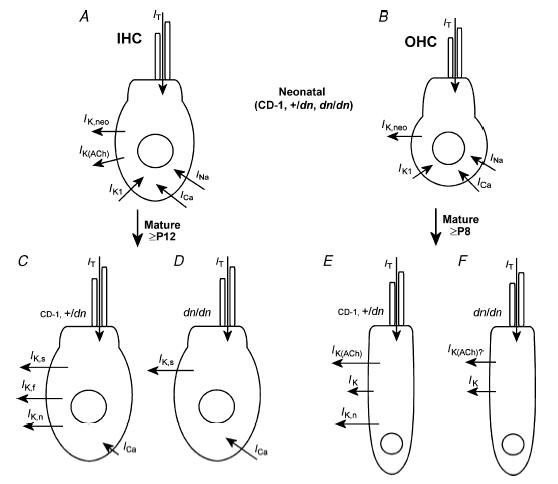
The deafness (dn) and Beethoven (Bth) mutant mice are models for profound congenital deafness (DFNB7/B11) and progressive hearing loss (DFNA36), respectively, caused by recessive and dominant mutations of transmembrane cochlear-expressed gene 1 (TMC1), which encodes a transmembrane protein of unknown function. In the mouse cochlea Tmc1 is expressed in both outer (OHCs) and inner (IHCs) hair cells from early stages of development. Immature hair cells of mutant mice seem normal in appearance and biophysical properties. From around P8 for OHCs and P12 for IHCs, mutants fail to acquire (dn/dn) or show reduced expression (Bth/Bth and, to a lesser extent Bth/+) of the K+ currents which contribute to their normal functional maturation (the BK-type current IK,f in IHCs, and the delayed rectifier IK,n in both cell types). Moreover, the exocytotic machinery in mutant IHCs does not develop normally as judged by the persistence of immature features of the Ca2+ current and exocytosis into adulthood. Mutant mice exhibited progressive hair cell damage and loss. The compound action potential (CAP) thresholds of Bth/+ mice were raised and correlated with the degree of hair cell loss. Homozygous mutants (dn/dn and Bth/Bth) never showed CAP responses, even at ages where many hair cells were still present in the apex of the cochlea, suggesting their hair cells never function normally. We propose that Tmc1 is involved in trafficking of molecules to the plasma membrane or serves as an intracellular regulatory signal for differentiation of immature hair cells into fully functional auditory receptors.


Figures

Figure 1
Figure 1. Morphological and physiological properties of deafness cochleae
A, low-resolution scanning electron micrographs (SEM) from the apical (80–90%), middle (40–50%) and basal (10–20%) regions of P30 +/dn and dn/dn cochleae, showing the three rows of V-shaped hair bundles of OHCs and one row of crescent-shaped bundles of IHCs. Hair cell degeneration in dn/dn only appears to be present in the 40–50% and 10–20% regions. Scale bar represents 5 μm. B, mean compound action potential (CAP) thresholds in +/dn (▴) and dn/dn (▪) mice aged P30. The dn/dn mice showed no CAP response at the maximum sound intensities that could be used, which is represented with arrows pointing upwards. Sound frequency (lower axis) is scaled tonotopically as percentage distance (upper axis) from the base (calculated from Ehret, 1975). C, hair cell counts, using high-resolution SEM, per 100 μm in the same three relevant areas of P30 mouse cochleae described in A. Filled and diagonally striped bars (\) represent normal hair cells observed in the +/dn and dn/dn cochlea, respectively. The more densely striped bars (/) represent degenerating hair cells.
Figure 2
Figure 2. Morphological characteristics of Beethoven cochleae
A, low-resolution SEM of +/+, Bth/+ and Bth/Bth at P15 from the same three cochlear regions as in Fig. 1A, B and C, SEM of Bth/Bth at P30 and P60, respectively. Bth/Bth cochleae show degeneration of both hair cell types in the 40–50% and 10–20% regions at all ages. No clear signs of degeneration were observed in the apical region (80–90%) of P15 Bth/Bth, or in any region of P15 Bth/+ cochleae. Scale bar represents 5 μm.
Figure 3
Figure 3. Physiological properties and hair cell survival of Beethoven cochleae
A and B, average CAP (top panels) and hair cell counts per 100 μm of the cochlear coil using high-resolution SEM (bottom panels) in +/+, Bth/+ and Bth/Bth mice at P15 and P60, respectively. The arrows shown for CAP responses in Bth/Bth mice indicate that the actual thresholds could not be measured because they must have been higher than the maximum sound intensities used (▪). The open bars shown in A and B (bottom panels) represent normal hair cells observed in the +/+ cochlea; filled bars are the normal cells in the Bth/+ cochlea, the striped bars (\) indicate normal cells in the Bth/Bth cochlea and the more densely striped bars (/) represent degenerating hair cells in all genotypes. C, endocochlear potential measured in Beethoven mice at P15 (▪), P30 (▴) and P60 (•). Horizontal lines represent the mean values of endocochlear potential at each age.
Figure 4
Figure 4. Mechano-electrical transducer currents in deafness and Beethoven mutant mice
A and B, transducer currents recorded from a control +/dn (A) and a mutant dn/dn (B) OHC (P8, apical coil) by applying sinusoidal force stimuli of 45 Hz. Driver voltage signal (DV; amplitude 35 V) to the fluid jet is shown above the traces. Positive deflections of the DV are excitatory. The cells were held at −84 mV, and the membrane potential was stepped between −104 mV and +96 mV in 20 mV increments. For clarity, only responses to every other voltage step are shown. Current recordings in this and in the following figures are single traces unless otherwise stated. Traces in A and B are offset so that the zero-transducer current levels (responses to inhibitory stimuli) are equally spaced. +/dn: Cm 6.3 pF, Rs 1.2 MΩ. dn/dn: Cm 5.8 pF, Rs 2.5 MΩ. Bundle height for both cells 4 μm. C and D, absolute size of the transducer current, using saturating stimuli, at membrane potentials of −104 mV and + 96 mV in dn (C) and Bth (D) controls and mutant mice. All recordings were at room temperature.
Figure 5
Figure 5. K+ currents in OHCs from deafness mutant mice
A and B, total current recorded from a control (A, +/dn) and a mutant (B, dn/dn) P7 apical-coil OHC. Membrane currents were elicited in response to depolarizing voltage steps (10 mV increments) from −104 mV to the various test potentials shown by some of the traces, starting from the holding potential of −84 mV. In this and in the following figure (panels A and B), arrows indicate the presence of the inward Ca2+ currents in immature IHCs. +/dn: Vm−68 mV; Cm 6.6 pF; Rs 4.1 MΩ; gleak 1.5 nS; dn/dn: Vm−69 mV; Cm 6.3 pF; Rs 1.5 MΩ; gleak 2.6 nS. C, size of IK,neo measured at 160 ms and at 0 mV in both +/dn and dn/dn apical OHCs. D and E, typical membrane currents recorded from +/dn (D) and dn/dn (E) P8 apical-coil OHCs. Currents were elicited by applying depolarizing voltage steps in 10 mV increments starting from −124 mV from the holding potential of −84 mV. Note the absence of the negatively activating K+ current IK,n in the dn/dn OHC (E). +/dn: Vm−72 mV; Cm 5.8 pF; Rs 1.8 MΩ; gleak 1.8 nS; dn/dn: Vm−66 mV; Cm 5.7 pF; Rs 1.4 MΩ; gleak 1.7 nS. F and G, membrane currents recorded from +/dn (P15) and dn/dn (P14) OHCs, respectively. Voltage protocol as in D and E. IK,n was absent in dn/dn OHCs, leaving only the small delayed rectifier IK. +/dn: Vm−79 mV; Cm 10.8 pF; Rs 2.5 MΩ; gleak 2.0 nS. dn/dn: Vm−66 mV; Cm 8.2 pF; Rs 2.8 MΩ; gleak 1.6 nS. H, size of IK,n measured as the difference between instantaneous and steady-state deactivating tail currents for voltage steps from −84 mV to −124 mV in +/dn (n = 5, P14–P15) and dn/dn (n = 5, P14) mice. All recordings were at room temperature.
Figure 6
Figure 6. K+ currents in IHCs from deafness mutant mice
A and B, current recordings under voltage clamp from control (+/dn) and mutant (dn/dn) immature apical-coil IHCs (P7), respectively. Outward K+ currents (IK,neo) were elicited in response to depolarizing voltage steps (10 mV nominal increments) from −104 mV starting from the holding potential of −84 mV. +/dn: Vm−72 mV; Cm 7.0 pF; Rs 1.7 MΩ; gleak 4.0 nS; dn/dn: Vm−74 mV; Cm 8.3 pF; Rs 1.2 MΩ; gleak 1.3 nS. Recordings were at room temperature. C, size of IK,neo and the inward rectifier K+ current IK1 measured at 160 ms during voltage steps to 0 mV and −154 mV, respectively, in both +/dn and dn/dn IHCs. D and E, total outward K+ currents recorded from +/dn(IK,f+IK,s) and dn/dn (IK,s) apical IHCs (P58), respectively. Current recordings were elicited by applying depolarizing voltage steps in 10 mV nominal increments from −84 mV. The insets show the onset of the total current recorded from the same cells shown in A and B using shorter (20 ms) voltage steps of which the first 10 ms are shown. Note the slower current activation in dn/dn due to the absence of IK,f. +/dn: Vm−72 mV; Cm 7.2 pF; Rs 1.3 MΩ; gleak 12.0 nS. dn/dn: Vm−69 mV; Cm 6.4 pF; Rs 1.3 MΩ; gleak 1.0 nS. F, size of the total steady-state currents (IK,f+IK,s) and the isolated IK,f and IK,s measured at −25 mV in both +/dn (n = 8, P18–P58) and dn/dn (n = 14, P17–P58) IHCs. G and H, membrane currents recorded from +/dn and dn/dn IHCs (P58) in response to voltage steps in 10 mV increments from −124 mV to more depolarized values starting from the holding potential of −64 mV. Note that IK,f and IK,n(as for OHCs) were not present in the mutant cell. +/dn: Vm−76 mV; Cm 9.1 pF; Rs 1.5 MΩ; gleak 11.5 nS. dn/dn: Vm−64 mV; Cm 6.5 pF; Rs 1.9 MΩ; gleak 0.4 nS. I, size of IK,n measured as the difference between instantaneous and steady-state deactivating tail currents for voltage steps from −64 mV to −124 mV in +/dn (n = 5, P41–P58) and dn/dn (n = 14, P41–P58) mice. Recordings in D–I were at body temperature.
Figure 7
Figure 7. K+ currents in mature IHCs and OHCs from Beethoven mutant mice
A and B, outward K+ currents in a control IHC (+/+, P18) and a homozygous mutant IHC (Bth/Bth, P21), respectively. In this figure, all current recordings were obtained using the same voltage protocols described in Fig. 5 (for OHCs) and Fig. 6 (for IHCs). In contrast to deafness mutants, some residual IK,f is still present in the Bth/Bth IHC (B). +/+ IHC: Vm−75 mV; Cm 10.0 pF; Rs 0.4 MΩ; gleak 6.0 nS. Bth/Bth IHC: Vm−76 mV; Cm 10.0 pF; Rs 1.6 MΩ; gleak 2.0 nS. C, size of the total current (IK,f+IK,s) and the isolated IK,f and IK,s measured at −25 mV in +/+ (n = 7, P19–P20), Bth/+ (n = 6, P16–P22) and Bth/Bth (n = 17, P16–P22) IHCs. D and E, membrane currents recorded from P18 +/+ (D) and P21 Bth/Bth (E) IHCs. Note the small residual IK,n present in the Bth/Bth cell. Both cells are the same as in A and B. F and G, current recordings from +/+ (F) and Bth/Bth (G) P17 OHCs. As for IHCs, IK,n was very small in the Bth/Bth OHC. +/+ OHC: Vm−77 mV; Cm 10.8 pF; Rs 1.9 MΩ; gleak 0.5 nS. Bth/Bth OHC: Vm−69 mV; Cm 10.0 pF; Rs 1.8 MΩ; gleak 1.0 nS. H, size of IK,n measured as the difference between instantaneous and steady-state deactivating tail currents for voltage steps from −64 mV for IHCs and −84 mV for OHCs to −124 mV in +/+ (IHCs: n = 6, P41–P58; OHCs: n = 8, P15–P17), Bth/+ (IHCs: n = 4, P41–P58; OHCs: n = 12, P14–P17) and Bth/Bth (IHCs: n = 7, P41–P58; OHCs: n = 19, P14). The symbol ≅ before IK,s and IK indicates that these currents are contaminated by residual currents not fully absent in Bth/Bth hair cells. All recordings were at room temperature.
Figure 8
Figure 8. Ca2+ currents and ΔCm in mature deafness and Beethoven IHCs
A and B, inward ICa recordings from +/dn and dn/dn IHCs (P18), respectively, in response to voltage steps from the holding potential of −81 mV to more depolarized levels in 10 mV increments. For clarity only some of the traces are shown and the membrane potentials (inmV) are indicated next to the traces. The current traces in A and B are averages from five and six repetitions, respectively. +/dn: Cm 8.3 pF; Rs 6.8 MΩ; gleak 4.0 nS. dn/dn: Cm 6.3 pF; Rs 7.9 MΩ; gleak 1.3 nS. C, ICa (middle panel) and ΔCm (bottom panel) responses in adult IHCs from +/dn and dn/dn mice elicited by applying 100 ms depolarizing voltage steps from the holding potential of −81 mV to near −21 mV. +/dn: Cm 7.5 pF; Rs 6.0 MΩ; gleak 3.2 nS; Peak ICa−145 pA elicited a ΔCm of 45 fF. dn/dn: Cm 6.3 pF; Rs 7.9 MΩ; gleak 0.4 nS; Peak ICa−336 pA elicited a ΔCm of 49 fF. The command protocol (top panel) consists of a sinusoidal waveform (used to track Cm) that appears as a thick black line, which is interrupted for the duration of the voltage steps. D, peak current–voltage (ICaV, upper panel) and capacitance–voltage (ΔCmV, lower panel) curves, measured at different membrane potentials from −81 mV to more depolarized potentials in nominal 10 mV increments, from the +/dn (n = 4, P17) and dn/dn (n = 5, P18) IHCs. E, average peak (near −21 mV) ICa recorded in mature IHCs from normal CD-1 (P16–P20), +/dn (P17), dn/dn (P18), +/+and Bth/+ (P16–P17) and Bth/Bth (P17). F, average ΔCm measured in response to the ICa recorded in E. G, average ΔCm responses plotted against the corresponding ICa size from the I–V and ΔCmV curves shown in (D). Continuous lines are fits to data points according to eqn (1). All recordings were at body temperature.
Figure 9
Figure 9. Voltage responses of IHCs from deafness mice
A and B, voltage responses under current clamp from +/dn (A) and dn/dn (B) IHCs at P8. Depolarizing current injections (+100 pA) triggered action potentials. The membrane potential (V) is plotted along the ordinates. +/dn: Vm−78 mV; Cm 9.4 pF; Rs 5.0 MΩ. dn/dn: Vm−79 mV; Cm 9.9 pF; Rs 6.2 MΩ. C, voltage responses from a P41 +/dn IHC. Vm−74 mV; Cm 8.2 pF; Rs 7.1 MΩ. D, voltage responses from a P41 dn/dn IHC exhibiting slow repetitive action potentials when small current injections were applied. Vm−64 mV; Cm 6.2 pF; Rs 6.2 MΩ. E and F, average resting membrane potentials (Vm) of IHCs and OHCs, respectively, from dn and Bth mutant mice. IHCs: +/dn, P18–P58; dn/dn, P17–P58; +/+, Bth/+ and Bth/Bth, P19–P20. OHCs: +/dn and dn/dn, P14; +/+ and Bth/+, P14–P17; Bth/Bth, P12–P17. All recordings were at body temperature.
Figure 10
Figure 10. Main physiological differences between immature and mature hair cells from normal CD-1 mice and deafness mutant mice
A and B, schematic representation showing the different types of membrane currents likely to be expressed in immature IHCs (A) and OHCs (B) from normal CD-1, +/dn and dn/dn mice. C and E, currents expressed by mature hair cells of +/dn and normal CD-1 mice. D and F, membrane currents expressed in mutant hair cells. For IK(ACh) there is some uncertainty as the data are only from Bth/Bth. IT is the mechano-electrical transducer current. The effects of the Tmc1 mutation on the various ionic currents are qualitatively similar but less severe in Bth/Bth and least severe in Bth/+ (see text for details).

References

    1. Augustine GJ, Charlton MP, Smith SJ. Calcium entry and transmitter release at voltage-clamped nerve terminals of squid. J Physiol. 1985;367:163–181. - PMC - PubMed
    1. Beutner D, Moser T. The presynaptic function of mouse cochlear inner hair cells during development of hearing. J Neurosci. 2001;21:4593–4599. - PMC - PubMed
    1. Bock GR, Frank MP, Steel KP. Preservation of central auditory function in the deafness mouse. Brain Res. 1982;239:608–612. - PubMed
    1. Bock GR, Steel KP. Inner ear pathology in the deafness mutant mouse. Acta Otolaryngol. 1983;96:39–47. - PubMed
    1. Brandt A, Striessnig J, Moser T. CaV1.3 channels are essential for development and presynaptic activity of cochlear inner hair cells. J Neurosci. 2003;23:10832–10840. - PMC - PubMed

Publication types

LinkOut - more resources