. 2006 Jun 15;573(Pt 3):627-43.
doi: 10.1113/jphysiol.2005.095448. Epub 2006 Apr 20.

Crossbridge and non-crossbridge contributions to tension in lengthening rat muscle: force-induced reversal of the power stroke

Affiliations

Crossbridge and non-crossbridge contributions to tension in lengthening rat muscle: force-induced reversal of the power stroke

G J Pinniger et al. J Physiol. .

Abstract

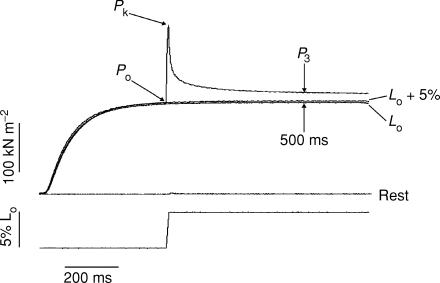
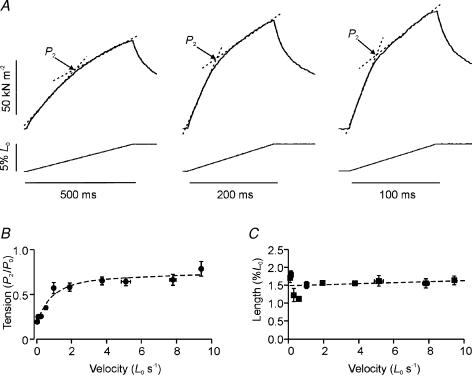
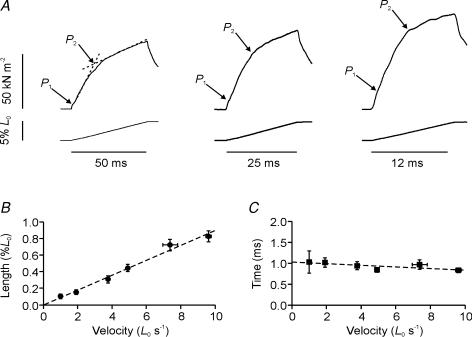
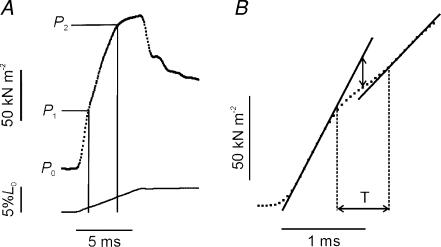
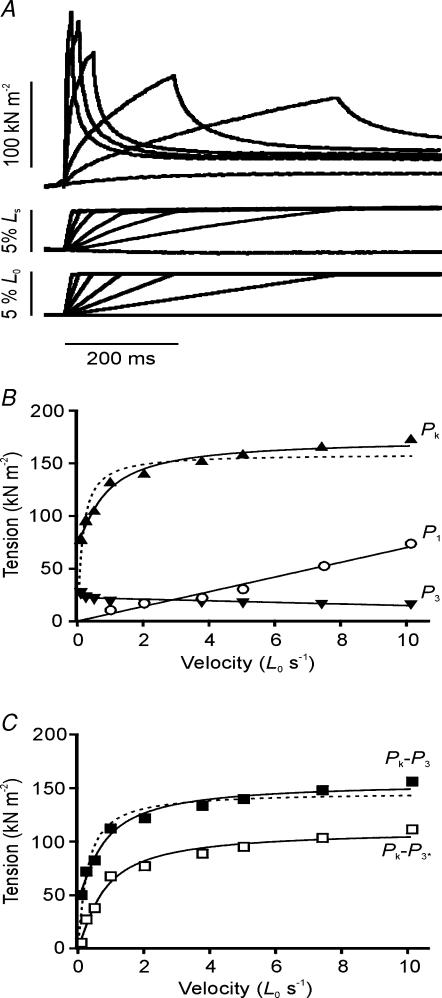
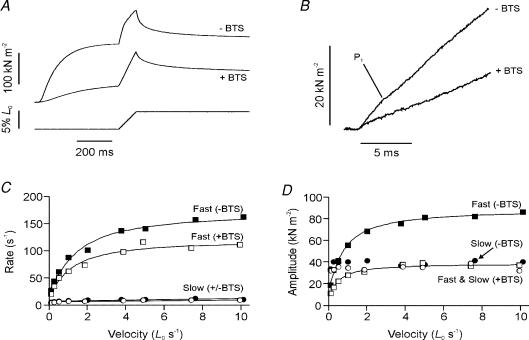
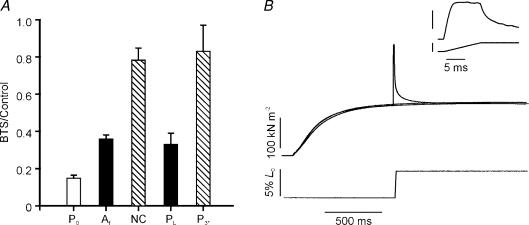
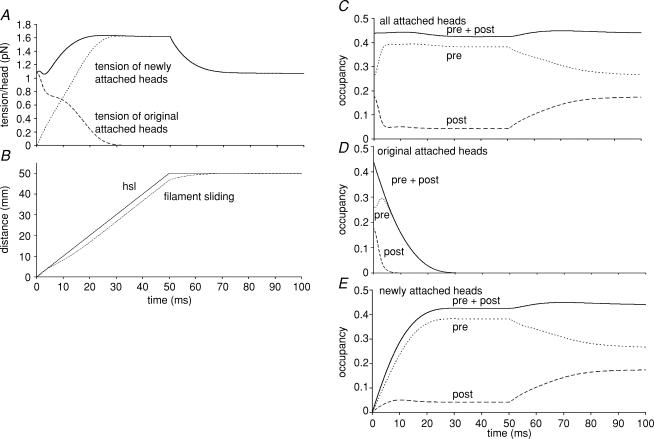
Lengthening of active muscle is an essential feature of animal locomotion, but the molecular processes occurring are incompletely understood. We therefore examined and modelled tension responses to ramp stretches (5% fibre length, L0) over a wide range of velocities (0.1-10 L(0) s(-1)) of tetanized intact rat muscle fibre bundles (L0 approximately 2 mm) with a resting sarcomere length of 2.5 microm at 20 degrees C. Tension rose to a peak during stretch and decayed afterwards to a level which was higher than the prestretch tetanic tension. This residual force enhancement was insensitive to velocity. The tension rise during stretch showed an early transition (often appearing as an inflection) at approximately 1 ms. Both the stretch (L1) and the tension rise at this transition increased in proportion to velocity. A second transition, marked by a reduction in slope, occurred at a stretch of approximately 18 nm per half-sarcomere; the rise in tension at this transition increased with velocity towards a plateau. Based on analyses of the velocity dependence of the tension and modelling, we propose that the initial steep increase in tension arises from increasing strain of all attached crossbridges and that the first transition reflects the tension loss due to the original post-stroke heads executing a reverse power stroke. Modelling indicates that the reduction in slope at the second transition occurs when the last of the heads that were attached at the start of the ramp become detached. Thereafter, the crossbridge cycle is largely truncated, with prepower stroke crossbridges rapidly detaching at high strain and attaching at low strain, the tension being borne mainly by the prestroke heads. Analysis of the tension decay after the ramp and the velocity dependence of the peak tension suggest that a non-crossbridge component increasingly develops tension throughout the stretch; this decays only slowly, reaching at 500 ms after the ramp approximately 20% of its peak value. This is supported by the finding that, in the presence of 10 microm N-benzyl-p-toluene sulphonamide (a myosin inhibitor), while isometric tension is reduced to approximately 15%, and the crossbridge contribution to stretch-induced tension rise is reduced to 30-40%, the peak non-crossbridge contribution and the residual force enhancement remain high. We propose that the residual force enhancement is due to changes upon activation in parallel elastic elements, specifically that titin stiffens and C-protein-actin interactions may be recruited.


Figures

Figure 1
Figure 1. Time course of tension rise in response to a ramp stretch
Sample recordings from one preparation illustrating the tension response (upper trace) to a ramp stretch (lower trace) at 10 L0 s−1 applied on the plateau of a tetanic contraction. Also shown are the tension recordings during isometric tetanic contractions at L0 and the extended length (L0+ 5%) as well as the tension response to a ramp stretch applied at rest.
Figure 2
Figure 2. Tension response to slow stretches
A, three tension responses (upper traces) to 5% ramp stretches (lower traces) at slow velocities of 0.1 (left), 0.25 (middle) and 0.5 L0 s−1 (right). The tension rise shows a change in slope (labelled P2). The P2 tension was measured as shown. B, dependence on stretch velocity of P2 tension (normalized to P0, curve fitted by eye). Pooled data are shown from seven bundles. C, dependence on stretch velocity of the stretch amplitude at P2 (L2) from the same bundles.
Figure 3
Figure 3. Tension response to fast stretches
A, three tension responses (upper traces) to 5%L0 ramp stretches (lower traces) at velocities of 1 (left), 2 (middle) and 4 L0 s−1 (right). The tension rise shows a change in slope, labelled P1, that preceded the P2 transition. B, effect of velocity on the stretch amplitude (L1) at which the P1 transition occurred. Pooled data are shown for seven bundles. C, the time after the start of the stretch at which the P1 transition occurred; pooled data from seven bundles.
Figure 4
Figure 4. Characteristics of the P1 transition
A, a selected tension trace recorded during a ramp stretch at 10 L0 s−1 (a higher velocity than in Fig. 3) showing the occurrence of two transitions on the rising phase. The incremental tension and length change at P1 were measured directly from the data record as shown by the first vertical line. B, the same tension trace as shown in A at an expanded time scale. At this resolution the P1 transition is seen as an inflection, the initial slope decreasing before increasing again. Continuous lines represent linear regressions used to estimate the start and end of the transition period (T). The tension offset due to reversal of the power stroke was estimated as twice the amplitude of the vertical displacement between the extrapolated initial regression line and the mid-point or point of inflection of the transition period (vertical arrow); the vertical displacement in this case is 15.6 kN m−2. The initial rate of tension rise in this record was 6 × 10³ kN L0−1 and decreased to 4 × 10³ kN L0−1 after the P1 transition; the duration of the transition period was 0.61 ms. Note, this trace was selected because it shows clearly the inflection point at P1; the amplitude of the vertical displacement at P1 is larger than the group mean.
Figure 5
Figure 5. Velocity dependence of the tension responses
A, the tension responses (upper traces) to ramp stretches (lower traces) at a range of velocities (0.1–4.0 L0 s−1) from one bundle are shown; middle traces show displacement of a marker placed on the surface of the fibre bundle (segment length responses). The rate of tension development and the rate of tension decay increased with stretch velocity; the tension decayed to a similar level (P3 above the isometric tension, the lowest tension record) when measured 500 ms after the end of the ramp. Note, the tension trace at the slowest stretch velocity has been truncated before reaching this point. B, velocity dependence of Pk (▴), P3 (▾) and P1 (○) from one fibre bundle. The Pk tension increased with velocity towards a plateau, P3 was relatively insensitive to velocity and P1 increased in proportion to velocity with a slope of 6.97 kN m−2 per L0 s−1. The dashed line represents the curve fit to Pk using eqn (1) in the text. A better fit (continuous line) was obtained using eqn (2), where Vc= 1.46 L0 s−1, PL= 100 kN m−2, and P3*= 73.45 kN m−2. In this example, P3* is approximately fivefold greater than the measured P3 tension. C, velocity dependence of PkP3 (▪) and PkP3* (□). For PkP3 data, the dashed curve represents the fit of eqn (1) and the continuous curve of eqn (2), where Vc= 1.30 L0 s−1, PL= 111 kN m−2, and P3*= 44.71 kN m−2. Note that PkP3* data and the fitted curve (pure viscoelastic equation, eqn (2) with P3*= 0) characterize the velocity dependence of force in the crossbridge component only. Note the intercept on the Pk axis (Fig. 5B) is P3* and on the PkP3 axis (Fig. 5C) is P3*−P3.
Figure 6
Figure 6. Effects of BTS on tension responses
A, tension responses to ramp stretches (0.5 L0 s−1) recorded in the absence (−BTS) and presence (+BTS) of 10 mm BTS. B, the same tension trace as shown in A at an expanded time scale. At this resolution it can be seen that the P1 transition is abolished in the presence of BTS. C and D, rates (C) and amplitudes (D) of the two components of the tension decay after the ramp stretch in the absence (filled symbols) and presence (open symbols) of BTS (fast, squares; slow, circles).
Figure 7
Figure 7. Examination of non-crossbridge component
A, effects of BTS on tension contribution by the two components. Bars represent the mean (±s.e.m.) BTS/control tension ratios from 4 fibre bundles. The ratio for isometric tetanic tension P0 is shown by the open column. The ratios for PL and P3* are from analyses of the peak tension versus velocity data and amplitude of fast (Af) and amplitude of slow plus P3 (labelled NC) from analysis of the tension relaxation. Note that, with either analysis, the non-crossbridge contribution (hatched columns) is much less depressed than the crossbridge contribution (filled columns). B, absence of residual force enhancement after stretch in a slow muscle. Tension response (upper trace) to a ramp stretch at 5 L0 s−1 (lower trace) on a small bundle of soleus muscle fibres. Also shown are the isometric tetanic contractions at L0 and the extended length (L0+ 5%). The inset shows the tension response to the stretch at a higher resolution. Note that the residual tension (P3) and the tension rise after the P2 transition are absent.
Figure 8
Figure 8. Simulation of the tension transients during and after a ramp stretch using a model of the crossbridge cycle
The ramp stretch shown is 50 nm hs−1 over 50 ms. A, time course of changes in tension expressed in pN per head. Continuous line is tension contribution from all attached heads; dashed line, contribution from heads that were attached at the beginning of the ramp; and dotted line, tension contribution from heads that become attached during the course of the ramp. B, time course of change (nm) in half-sarcomere length (hsl) and distance of filament sliding (filament sliding). C, time course of changes in fractional occupancy of attached heads in the two conformations; pre + post, all attached heads; pre, prestroke conformation; post, post stroke conformation. D, as C but considering only the heads that were attached at the beginning of the ramp. E, as C but considering only the heads that newly attach during the course of the ramp. The simulations were based on the Lymn-Taylor kinetic scheme for actomyosin ATPase in solution (Lymn & Taylor, 1971). The rate constants and their dependence on strain were obtained by refining the model against both the shortening and lengthening limbs of the force–velocity relation of fast mammalian skeletal muscle at 20°C. In the refined model obtained with a power stroke distance of 11 nm and an equilibrium constant for the power stroke of 1000 in the absence of strain, the rate constant for the power stroke with zero strain was 13 200 s−1. The rate constant for the equivalent conformational change on free myosin was 30 s−1 with 120 s−1 that for the reverse step. The rate constant for attachment of prestroke heads to actin was 1.09 × 10⁵m−1 s−1 and that for detachment 97 s−1. The effective actin concentration was taken to be 1 mm. The unstrained rate constant for the irreversible step completing the cycle (the slow release of ADP followed by fast binding of ATP and detachment of the poststroke heads) was 706 s−1; the ΔD parameter defining the effect of strain on this rate (Smith & Geeves, 1995a) was 2.08 nm. The characteristic distance (Evans, 2001) required to reach the transition state for force-enhanced detachment of prestroke heads was 1.25 nm. The crossbridge stiffness was 0.562 pN nm −1. The filament compliance was calculated on the assumption that in isometric muscle 40% of the sarcomere compliance is due to crossbridges. Note that the non-crossbridge tension is not included in this calculation.

Similar articles

Cited by

References

    1. Abbott BC, Aubert XM. Changes of energy in a muscle during very slow stretches. Proc R Soc Lond B. 1951;139:104–117. - PubMed
    1. Abbott BC, Aubert XM. The force exerted by active striated muscle during and after change of length. J Physiol. 1952;117:77–86. - PMC - PubMed
    1. Bagni MA, Cecchi G, Cecchini E, Colombini B, Colomo F. Force responses to fast ramp stretches in stimulated frog skeletal muscle fibres. J Muscle Res Cell Motil. 1998;19:33–42. - PubMed
    1. Bagni MA, Cecchi G, Colombini B, Colomo F. A non-cross-bridge stiffness in activated frog muscle fibers. Biophys J. 2002;82:3118–3127. - PMC - PubMed
    1. Brenner B. Mechanical and structural approaches to correlation of cross-bridge action in muscle with actomyosin ATPase in solution. Ann Rev Physiol. 1987;49:655–672. - PubMed

Publication types

LinkOut - more resources