. 2006 May 17;25(10):2240-52.
doi: 10.1038/sj.emboj.7601099. Epub 2006 Apr 20.

Opaque cells signal white cells to form biofilms in Candida albicans

Affiliations

Opaque cells signal white cells to form biofilms in Candida albicans

Karla J Daniels et al. EMBO J. .

Abstract

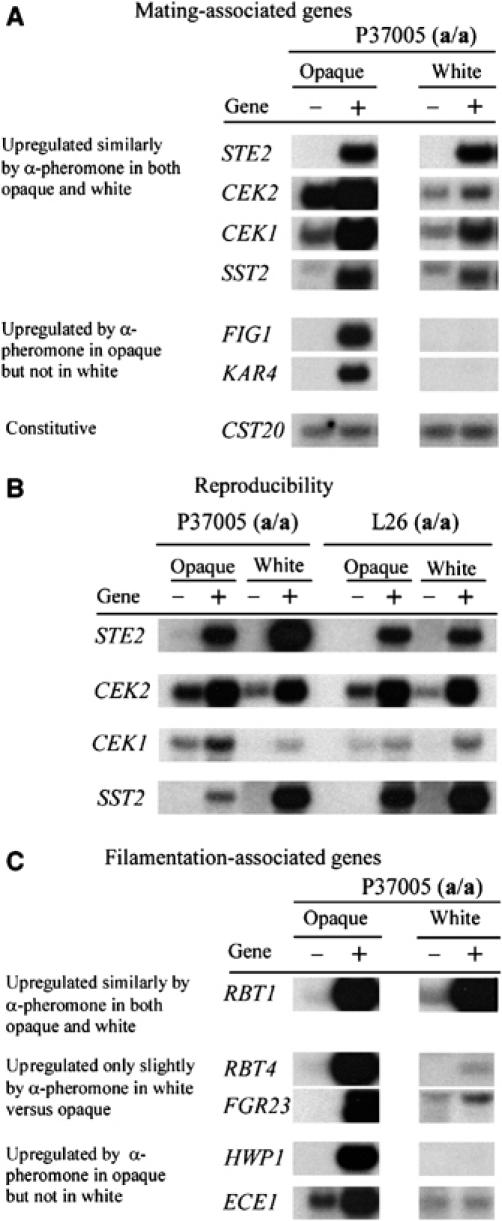
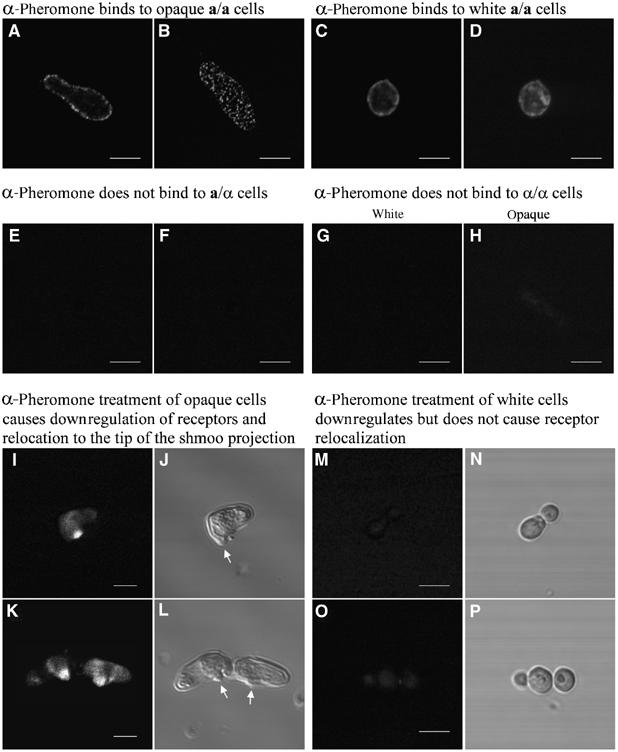
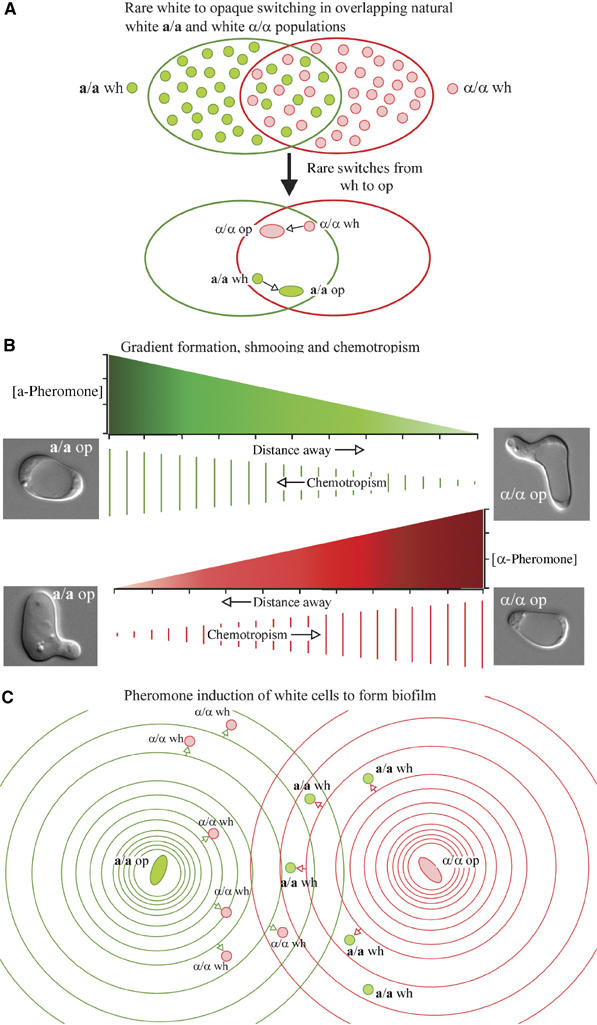
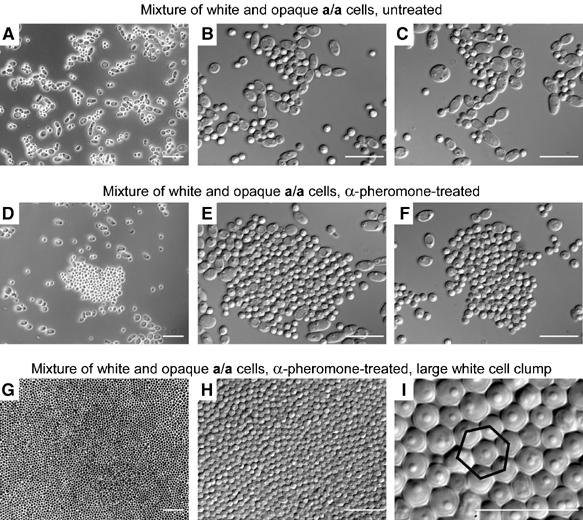
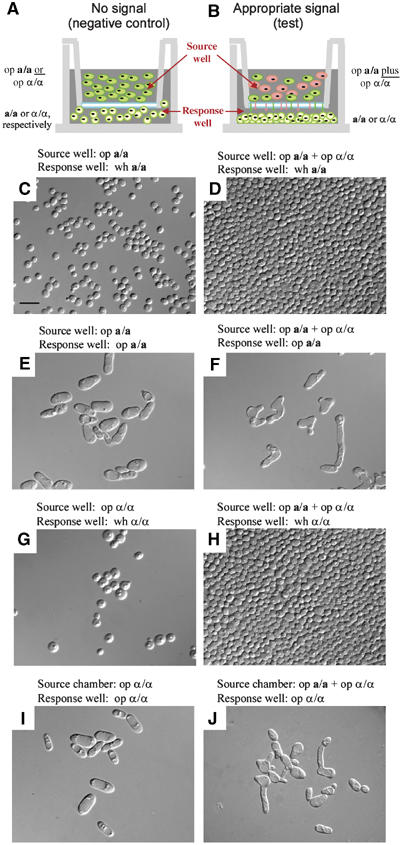
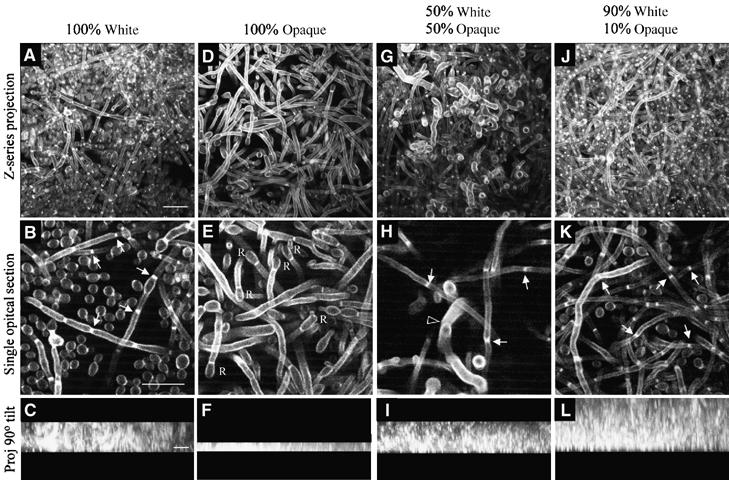
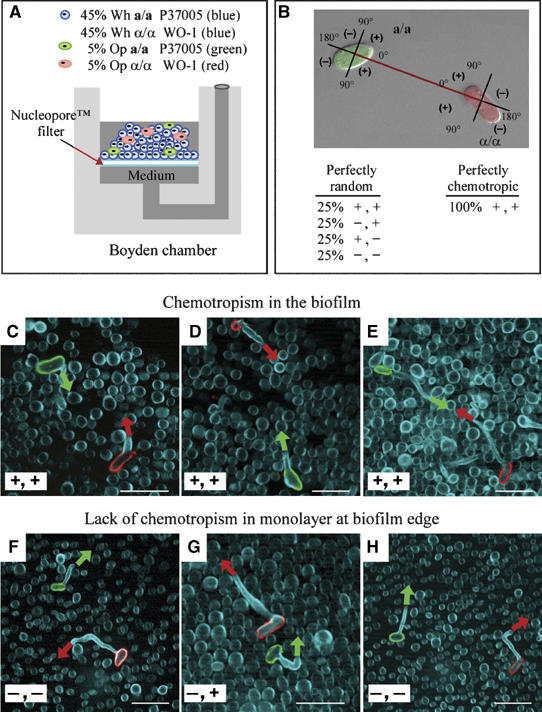
Upon homozygosis from a/alpha to a/a or alpha/alpha, Candida albicans must still switch from the 'white' to 'opaque' phenotype to mate. It was, therefore, surprising to discover that pheromone selectively upregulated mating-associated genes in mating-incompetent white cells without causing G1 arrest or shmoo formation. White cells, like opaque cells, possess pheromone receptors, although their distribution and redistribution upon pheromone treatment differ between the two cell types. In speculating about the possible role of the white cell pheromone response, it is hypothesized that in overlapping white a/a and alpha/alpha populations in nature, rare opaque cells, through the release of pheromone, signal majority white cells of opposite mating type to form a biofilm that facilitates mating. In support of this hypothesis, it is demonstrated that pheromone induces cohesiveness between white cells, minority opaque cells increase two-fold the thickness of majority white cell biofilms, and majority white cell biofilms facilitate minority opaque cell chemotropism. These results reveal a novel form of communication between switch phenotypes, analogous to the inductive events during embryogenesis in higher eukaryotes.


Figures

Figure 1
Figure 1
Northern analysis reveals that some, but not all, mating-associated and filamentation-associated genes upregulated by α-pheromone in opaque a/a cells are also upregulated by α-pheromone in white a/a cells. (A) Mating-associated genes. (B) A comparison of α-pheromone induction in the unrelated a/a strains P37005 and L26. (C) Filamentation-associated genes. Untreated control cells (−); α-pheromone-treated test cells (+).
Figure 2
Figure 2
White a/a cells express α-pheromone receptors on their surface, but the distribution prior to pheromone treatment and the redistribution after pheromone treatment differ from that of opaque cells. Live white or opaque cells were treated with biotinylated α-pheromone on ice, fixed, and stained with Oregon Green® streptavadin to assess receptor distribution. (A, B) Punctate staining pattern of opaque cells visualized by LSCM 1 μm above the substratum or at the substratum, respectively. (C, D) Uniform staining pattern of white cells visualized by LSCM 1 μm above the substratum or at the substratum, respectively. (E, F) α-Pheromone does not label a/α cells. (G, H) α-Pheromone does not stain white or opaque α/α cells, respectively. (I–L) α-Pheromone treatment of opaque a/a cells leads to downregulation and relocalization of receptors to the site of conjugation tube evagination in the shmoo. (M–P) α-Pheromone treatment of white a/a cells leads to downregulation, but not to relocalization, of receptors. Arrows in (J, L) denote conjugation tube evaginations. Scale bars, 2 μm.
Figure 3
Figure 3
Developing the hypothesis that opaque cells signal white cells of opposite mating type, through the release of pheromone, to form a biofilm that protects the opposing spatial gradients of pheromone that must develop for chemotropism to proceed. (A) In overlapping populations of natural white a/a and white α/α cells in the host, the predominant phenotype is white, but there are rare and transient switches from white to opaque. (B) An opaque a/a cell releases a-pheromone, which forms a spatial gradient that induces shmooing and promotes chemotropism of an opaque α/α cell, and vice versa. The spatial gradients of opposing pheromones are diagrammed between an opaque a/a and opaque α/α cell both as a graph of concentration as a function of distance (green and red, respectively) and as a sequence of parallel lines decreasing in length as concentration decreases. (C) The a-pheromone released by the rare opaque a/a cell and the α-pheromone released by the rare opaque α/α cell promote biofilm formation in white cells of opposite mating type. The spatial gradients of opposing pheromones are diagrammed as rings separated by greater distances denoting concentration decreases. Small arrows represent pheromone induction of white cells of opposite mating type to join in biofilm formation.wh, white; op, opaque.
Figure 4
Figure 4
α-Pheromone induces cohesiveness between a/a white cells, but not between a/a opaque cells, in suspension cultures. Cells from each suspension culture were pipetted through a wide bore pipette onto a slide and pressed into a monolayer with a coverslip. (A–C) Mixture of untreated white (60%) and opaque (40%) a/a cells (strain P37005). (D–F) Mixture of white (60%) and opaque (40%) a/a cells treated with 3 × 10⁻⁶ M α-pheromone. (G–I) Increasing magnification of α-pheromone-treated white a/a cells in a large clump pressed into a monolayer by a coverslip on a microscope slide. Neighboring cells form a hexagonal array around each cell according to ‘closest sphere packing' geometry (Fuller, 1975). Scale bar, 10 μm.
Figure 5
Figure 5
α-Pheromone selectively induces white a/a cells to form a cohesive film adhering to plastic. (A) White a/a cells treated with α-pheromone. (B) Opaque a/a cells treated with α-pheromone. (C) White α/α cells treated with α-pheromone. (D) Opaque α/α cells treated with α-pheromone. (E) White a/a cells untreated. (F) a/α cells treated with α-pheromone. Cells were inoculated into wells of a six-well cluster plate in the presence (+) or absence (–) of 3 × 10⁻⁶ M α-pheromone. After 16 h of undisturbed incubation at 29°C, the bottoms of the dishes were gently washed with buffered saline and photographed.
Figure 6
Figure 6
Natural α-pheromone released from opaque α/α cells and natural a-pheromone released from opaque a/a cells induce white cells of opposite mating type to form a cohesive basal layer of cells on plastic. (A) Diagram of the apparatus under control conditions in which a/a or α/α cells are placed in the bottom well (response), and only opaque cells of the same mating type are placed in the top well (source). In this negative control configuration (no signal), there is no pheromone from opposite mating type to signal a response. (B) Diagram of the apparatus under test conditions in which a/a or α/α cells are placed in the response well and a mixture of opaque a/a plus opaque α/α cells is placed in the source well. Wells are separated by a nucleopore filter. In this test configuration, there is continuous release of both a- and α-pheromone from opaque a/a and α/α cells in the source well, which diffuse into the response well (arrows). Opaque a/a and opaque α/α cells presumably cross-stimulate pheromone production. Preparations were incubated for 16 h at 29°C, then the bottom of the response well was scraped and wet mounts were made of scraped cells. (C, D) Unstimulated and stimulated white a/a cells, respectively. (E, F) Unstimulated and stimulated opaque a/a cells, respectively. (G, H) Unstimulated and stimulated white α/α cells, respectively. (I, J) Unstimulated and stimulated opaque α/α cells, respectively. Scale bar, 5 μm. wh, white; op, opaque.
Figure 7
Figure 7
A minority of opaque cells enhance white cell biofilm development. Different proportions of white and opaque cells were mixed and the same total number of cells spread on a silicon elastomer. After 90 min of undisturbed incubation, the elastomers were gently rinsed, then flooded with fresh growth medium and gently rocked for 48 h. In all combinations, white cells were 50% a/a and 50% α/α, and opaque cells 50% a/a and 50% α/α. In all combinations, a monolayer of cells covered the elastomer at the initiation of rocking which reflected the proportions of white and opaque cells initially inoculated. (A, D, G, J) Z-series projection of multiphoton LSCM scans through the biofilm. (B, E, H, K) Single optical section in the middle of the biofilm. (C, F, I, L) Z-series projections viewed from the side (90° tilt). At the end of the incubation period, the top of each gel was identified by a precipitous decrease in pixel intensity. The small solid arrows in (B), (H) and (K) point to septae in hyphae. The unfilled arrowhead in (H) points to a conjugation tube. ‘R's in (E) refer to apical reversion to the budding growth form at the ends of conjugation tubes that have failed to fuse. Scale bar in the first image for each horizontal row represents 10 μm.
Figure 8
Figure 8
Majority white cell biofilms promote chemotropism between rare opaque a/a and opaque α/α cells. (A) Diagram of the modified Boyden chamber that was employed. The upper well was inoculated with 45% white a/a cells, 45% white α/α cells, 5% opaque a/a cells vitally stained green with fluorescein-conjugated ConA and 5% opaque α/α cells vitally stained red with rhodamine-conjugated ConA. Medium was replenished from below after 24 h. After 48 h at 29°C, cells were fixed, stained with calcofluor (Blue) and imaged by multiphoton LSCM. Cells were visualized in the upper region of the thickest portion of the biofilm or in the monolayer at the biofilm edge. Fields were scanned for a green and red cell that had formed conjugation tubes within 25 cell diameters of each other. (B) The orientation of the conjugation tubes was assessed as diagrammed. (CE). In the majority of cases in which a red and green cell were observed within 25 cell diameters of one another (18 of 20; 90%) in the three-dimensional upper region of the biofilm proper, their conjugation tubes were oriented in the approximate direction of each other (+, +). (FH) In the majority of cases in which a red and green cell were observed within 25 cell diameters of one another (16 of 20; 80%) in the two-dimensional monolayer at the edge of the biofilm proper, one or both tubes were oriented away from each other (+, − or −, + or −, −). a/a cells, strain P37005; α/α cells, strain WO-1. Scale bar, 5 μm.

References

    1. Anderson J, Mihalik R, Soll DR (1990) Ultrastructure and antigenicity of the unique cell wall pimple of the Candida opaque phenotype. J Bacteriol 172: 224–235 - PMC - PubMed
    1. Anderson JM, Soll DR (1987) Unique phenotype of opaque cells in the white–opaque transition of Candida albicans. J Bacteriol 169: 5579–5588 - PMC - PubMed
    1. Baillie GS, Douglas LJ (1999) Role of dimorphism in the development of Candida albicans biofilms. J Med Microbiol 48: 671–679 - PubMed
    1. Bedell G, Soll DR (1979) The effects of low concentrations of zinc on the growth and dimorphism of Candida albicans: evidence for zinc resistant and zinc sensitive pathways for mycelium formation. Infect Immun 26: 348–354 - PMC - PubMed
    1. Bennett RJ, Uhl MA, Miller MG, Johnson AD (2003) Identification and characterization of a Candida albicans mating pheromone. Mol Cell Biol 23: 8189–8201 - PMC - PubMed

Publication types