. 2006 May 17;25(10):2131-41.
doi: 10.1038/sj.emboj.7601094. Epub 2006 Apr 20.

pH-dependent conformational switch activates the inhibitor of transcription elongation

Affiliations

pH-dependent conformational switch activates the inhibitor of transcription elongation

Oleg Laptenko et al. EMBO J. .

Abstract

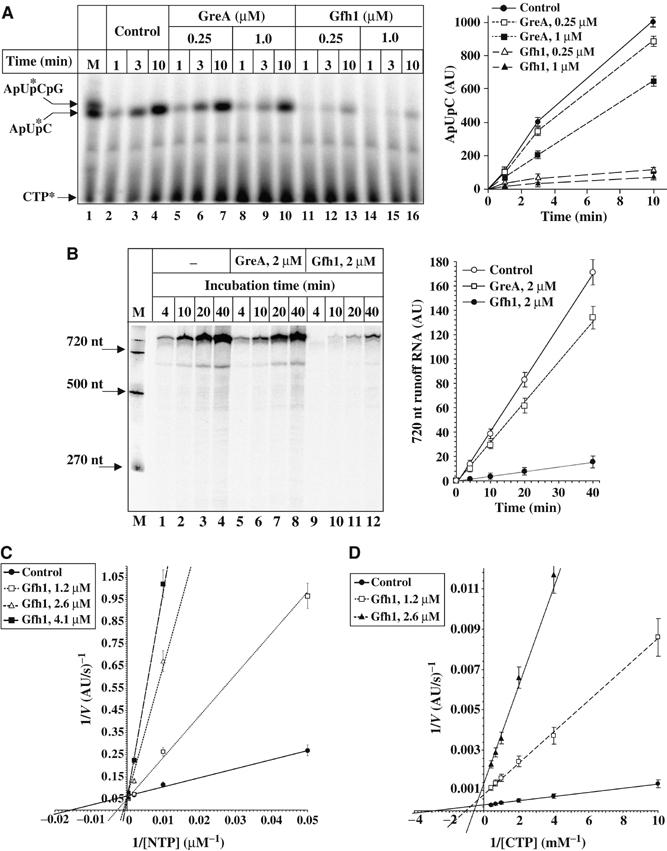
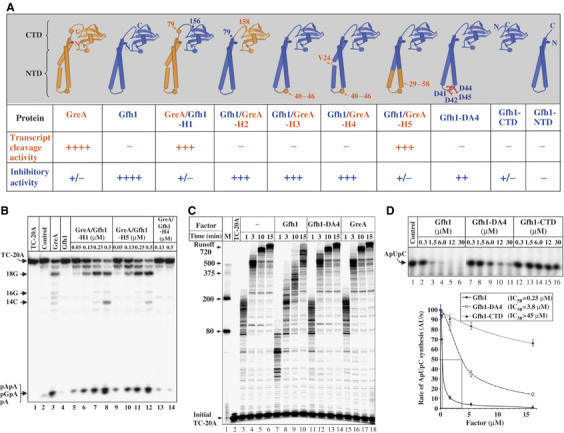
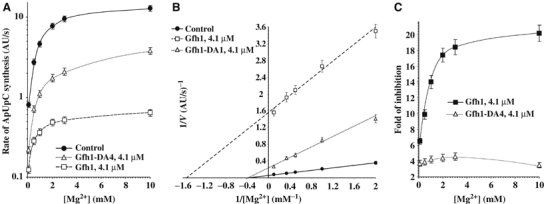
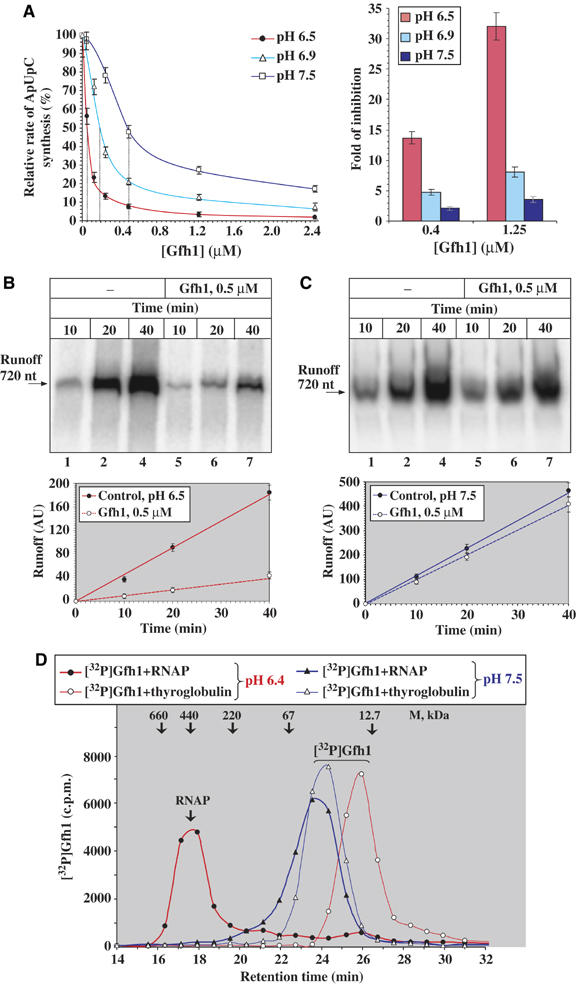
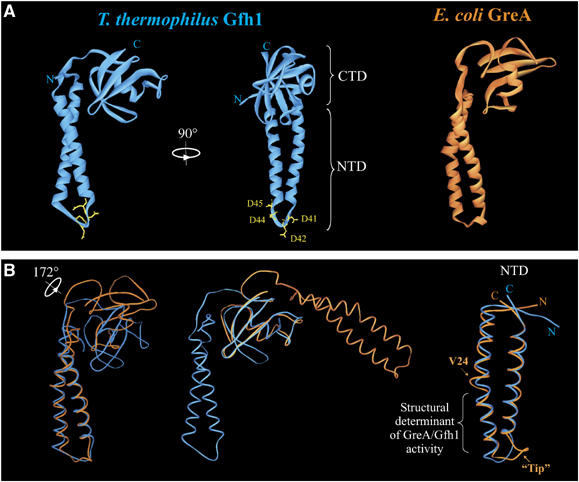
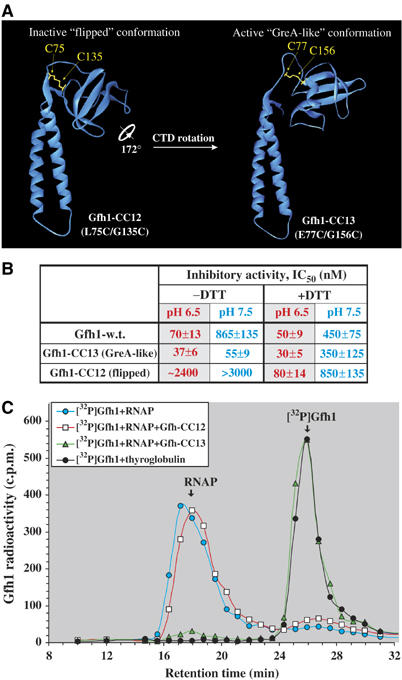
Gfh1, a transcription factor from Thermus thermophilus, inhibits all catalytic activities of RNA polymerase (RNAP). We characterized the Gfh1 structure, function and possible mechanism of action and regulation. Gfh1 inhibits RNAP by competing with NTPs for coordinating the active site Mg2+ ion. This coordination requires at least two aspartates at the tip of the Gfh1 N-terminal coiled-coil domain (NTD). The overall structure of Gfh1 is similar to that of the Escherichia coli transcript cleavage factor GreA, except for the flipped orientation of the C-terminal domain (CTD). We show that depending on pH, Gfh1-CTD exists in two alternative orientations. At pH above 7, it assumes an inactive 'flipped' orientation seen in the structure, which prevents Gfh1 from binding to RNAP. At lower pH, Gfh1-CTD switches to an active 'Gre-like' orientation, which enables Gfh1 to bind to and inhibit RNAP.


Figures

Figure 1
Figure 1
Analysis of Gfh1 inhibitory activity by in vitro transcription assays. (A) Abortive initiation. Left panel is the autoradiogram of urea–23% PAGE, which shows a time course of ApUpC synthesis in the presence or absence of protein factors at indicated concentrations. Each reaction contained 80 nM T7A1-50 promoter DNA, 0.3 μM Tth RNAP, 0.3 mM ApU, 50 μM CTP, and [α-32P]CTP (0.9 Ci/mmol). Positions of size markers are shown under ‘M'. Kinetics graph on the right is a quantification of the autoradiogram on the left. Here and elsewhere in text, the amount of product is expressed in arbitrary units, a.u. (1 a.u.=10 PhosphorImager counts). (B) Multiround runoff assay. Left panel is the autoradiogram of urea–8% PAGE showing a time course of 720-nt-long runoff transcript synthesis. Each reaction contained 15 nM T7A1-720 DNA, 25 nM Tth RNAP, 0.3 mM ApU, 1 mM each NTPs, [α-32P]ATP (0.15 Ci/mmol), and 50 μg/ml heparin incubated in the presence or absence of protein factors at indicated concentrations. Kinetics graph on the right is a quantification of the autoradiogram. DNA size markers are indicated on the left. (C) and (D) Double reciprocal plots showing the rate dependence of RNAP elongation (C) and abortive initiation (D) on substrate concentration under indicated conditions. Abortive synthesis reactions were carried out as in (A). For transcription elongation, each reaction containing 2–5 nM of the initial radiolabeled TC-20A obtained on T7A1-50 promoter (Laptenko and Borukhov, 2003) were incubated at 40°C for 1–10 min with different concentrations of NTPs in the presence or absence of protein factors. The initial rates of 50-mer runoff RNA (C) and ApUpC synthesis (D) were measured at 0.04–2 mM NTPs or 0.1–2.5 mM CTP, respectively.
Figure 2
Figure 2
Functional activities of Gfh1/GreA hybrid and mutant factors. (A) Schematic diagram showing the structure of engineered proteins and summary of their activities. Proteins are color coded to indicate the origin of corresponding part. Activities expressed as ++++, +++, ++, +/−, and − represent 50–100, 20–50, 5–20, 1–5, and <1% of the wt activity, respectively. Inhibitory activity was measured in abortive initiation assay as in (D). (B) The autoradiogram of urea–23% PAGE showing the results of transcript cleavage reactions induced in 20 nM radiolabeled TC-20A after incubation at 60°C for 10 min alone or in the presence of 100 nM GreA, 1 μM Gfh1, or hybrid proteins at indicated concentrations. (C) Autoradiogram of urea–8% PAGE showing the elongation time course of the initial TC-20A incubated at 40°C in the presence or absence of protein factors. Positions of DNA size markers are indicated on the left. (D) Top panel is the autoradiogram of urea–23% PAGE showing the synthesis of ApUpC (see Figure 1A) during 15 min reaction in the presence of wt Gfh1, Gfh1-4DA, or Gfh1-CTD used at different concentrations. Bottom graph shows rate dependence of ApUpC synthesis as a function of protein concentration. Estimated values of IC50 are indicated in the inset.
Figure 3
Figure 3
Inhibitory effect of wt Gfh1 and Gfh1-DA4 on abortive synthesis as a function of Mg2+ concentration. (A) Semilogarithmic plot shows the dependence of the initial rates of ApUpC synthesis (see Figure 1A) in the absence or presence of protein factors on Mg2+ concentration. (B) Double reciprocal plot of (A). (C) Graph shows Mg2+ dependence of the inhibitory activity of wt Gfh1 and Gfh1-DA4 during ApUpC synthesis. The data presented are derived form (A).
Figure 4
Figure 4
Inhibitory activity of Gfh1 as a function of pH. (A) Graph on the left shows the dependence of the relative rates of ApUpC synthesis (seeFigures 1A, 2D) on Gfh1 concentrations at pH 6.5, 6.9, and 7.5. Rates are expressed as % of rates of the control reaction at each pH in the absence of Gfh1. Each vertical dotted line indicates Gfh1 IC50. On the right, bar graph shows the effect of pH on the fold of inhibition by 0.4 and 1.2 μM Gfh1. (B) Inhibitory effect of Gfh1 during multiround runoff transcription at T7A1-720 promoter DNA at pH 6.5 (see Figure 1B). Top panel is the autoradiogram of urea–8% PAGE showing a time course of 720-nt-long RNA synthesis in the presence and absence of Gfh1. The graph below shows the quantification of the autoradiogram. (C) Same as (B) at pH 7.5. (D) Effect of pH on Gfh1-RNAP binding. Chromatographic plot shows the radioactivity profiles of free [32P]Gfh1 and [32P]Gfh1–RNAP core complexes during chromatography on Superose 6 column at pH 6.4 and 7.5 (Laptenko and Borukhov, 2003). Retention times and molecular weights of the protein size markers (thyroglobulin, ferritin, catalase, BSA, and cytochrome c) are indicated. The increased retention of radiolabeled Gfh1 (theoretical MW=18.9 kDa) observed at pH 6.4 (∼26 min corresponding to an apparent MW of ∼16 kDa) is owing to nonspecific adsorption of phosphorylated Gfh1 to the column matrix at this pH. Free unphosphorylated Gfh1 elutes from the column with retention time of ∼24.5 min (with an apparent MW of ∼26 kDa), both at pH 6.4 and 7.5 (data not shown).
Figure 5
Figure 5
Crystal structure of Tth Gfh1. (A) Ribbon representation of Gfh1 structure is shown in two orthogonal views (left and central panel). The location of the two domains, NTD and CTD, and the four Asp residues of NTD loop are indicated. The structure of E. coli GreA (Stebbins et al, 1995) is shown for comparison (right panel). (B) Superposition of the structures of E. coli GreA (orange) and Tth Gfh1 (blue) as Cα trace. Left panel shows the alignment by NTD and central panel shows alignment by CTD. Overall, the molecules superimposed well with r.m.s. deviation of the Cα atoms=1.8 Å with more than 90% equivalences. The rotation axis of the CTD is indicated. Right panel shows aligned NTDs, rotated by 60° counterclockwise around the NTD axis from the view shown in the left panel.
Figure 6
Figure 6
Effect of CTD conformation on functional activity of Gfh1. (A) Model structures of mutant factors with conformations fixed via S–S bridges, Gfh1-CC12 and Gfh1-CC13 are shown as ribbons. Models were generated by Swiss-Model (Schwede et al, 2003) using the structures of Tth Gfh1 and E. coli GreA as templates, respectively. (B) Summary of the inhibitory activities of wt and mutant Gfh1-CC factors. The IC50 values were obtained from abortive initiation assay as in Figure 4A–C, conducted under indicated conditions. (C) [32P]Gfh1–RNAP competition-binding assay. [32P]Gfh1–RNAP core complex was chromatographed with or without 20 μM competitor proteins, Gfh1-CC12 or Gfh1-CC13, at pH 6.4 under nonreducing conditions (see Figure 4D). Free oxidized forms of Gfh1-CC12 and Gfh1-CC13 all elute irrespective of pH with almost identical retention times of 24.5–24.7 min (the same as that of the wt Gfh1) corresponding to an apparent molecular weight of ∼26 kDa (data not shown), which, according to a light-scattering analysis, represents a monomer (see Supplementary data).
Figure 7
Figure 7
Analysis of in vivo expression levels and activities of Gfh1 and GreA. (A) Western blot analysis of wt Tth (HB-27) and mutant ΔgreA, Δgfh1, and ΔgreA∷Δgfh1 cells grown to log phase in rich TB medium at pH 7.5. Cell lysates were separated by SDS–PAGE and blotted using polyclonal antibodies against purified Tth GreA and Gfh1 as indicated. The blot demonstrates that GreA and Gfh1 were not present in the lysates of corresponding mutant cells. (B) Inhibitory effect of Gfh1 on the expression of nrc operon in vivo. The wt and mutant Tth strains were assayed using the β-Gal reporter expression system (Cava et al, 2004b) shown schematically in top. Below is the bar graph showing β-Gal activities expressed in Miller units (MU) from cell lysates grown at pH 7.4 and 6.2 after 4 h induction.

References

    1. Adelman K, Yuzenkova J, La Porta A, Zenkin N, Lee J, Lis JT, Borukhov S, Wang MD, Severinov K (2004) Molecular mechanism of transcription inhibition by peptide antibiotic Microcin J25. Mol Cell 14: 753–762 - PubMed
    1. Batada NN, Westover KD, Bushnell DA, Levitt M, Kornberg RD (2004) Diffusion of nucleoside triphosphates and role of the entry site to the RNA polymerase II active center. Proc Natl Acad Sci USA 101: 17361–17364 - PMC - PubMed
    1. Borukhov S, Lee J, Laptenko O (2005) Bacterial transcription elongation factors: new insights into molecular mechanism of action. Mol Microbiol 55: 1315–1324 - PubMed
    1. Brunger AT, Adams PD, Clore GM, DeLano WL, Gros P, Grosse-Kunstleve RW, Jiang JS, Kuszewski J, Nilges M, Pannu NS, Read RJ, Rice LM, Simonson T, Warren GL (1998) Crystallography & NMR system: a new software suite for macromolecular structure determination. Acta Crystallogr D 54: 905–921 - PubMed
    1. Cava F, de Pedro MA, Schwarz H, Henne A, Berenguer J (2004a) Binding to pyruvylated compounds as an ancestral mechanism to anchor the outer envelope in primitive bacteria. Mol Microbiol 52: 677–690 - PubMed

Publication types

MeSH terms

Associated data