. 2006 Apr;97(4):259-70.
doi: 10.1111/j.1349-7006.2006.00169.x.

Wilms' tumor gene WT1 17AA(-)/KTS(-) isoform induces morphological changes and promotes cell migration and invasion in vitro

Affiliations

Wilms' tumor gene WT1 17AA(-)/KTS(-) isoform induces morphological changes and promotes cell migration and invasion in vitro

Tanyarat Jomgeow et al. Cancer Sci. 2006 Apr.

Abstract

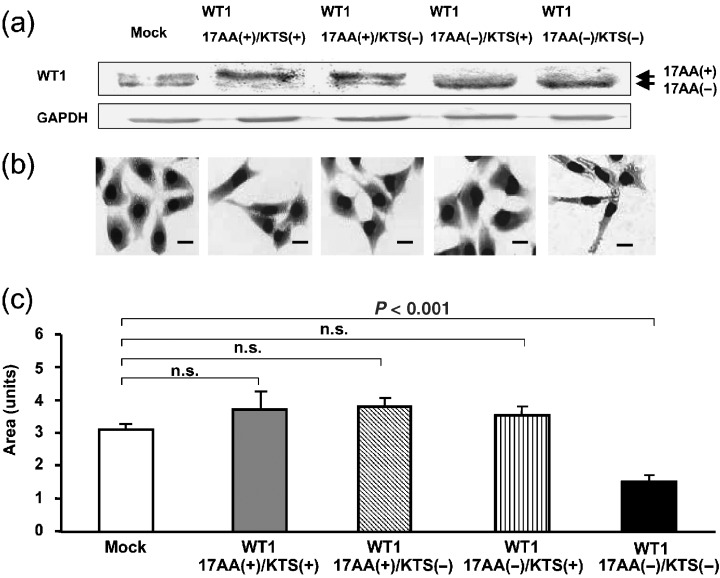
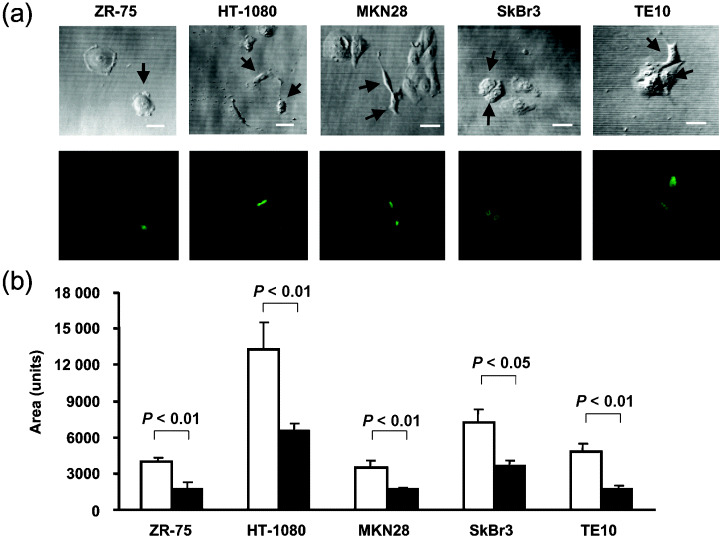
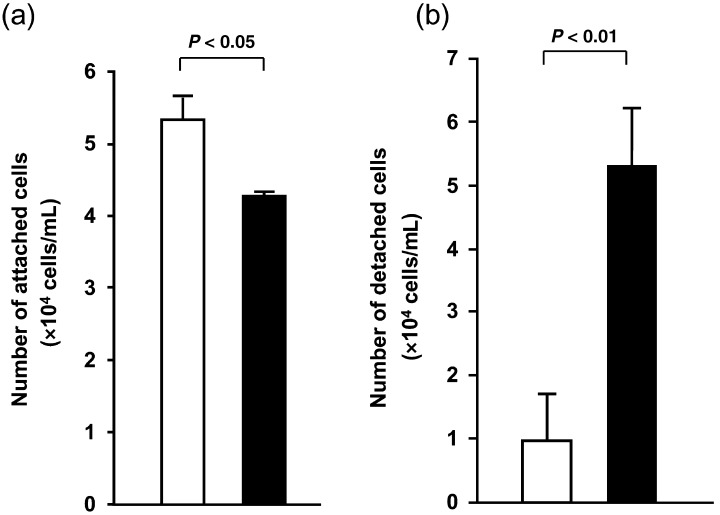
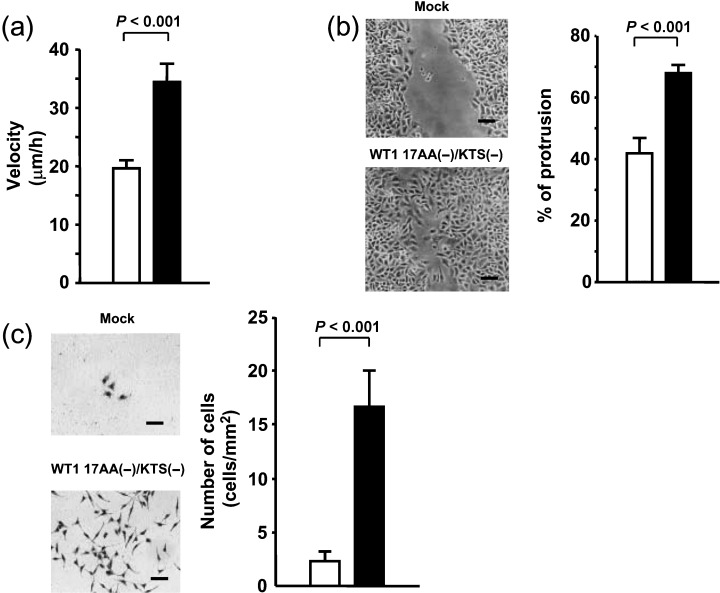
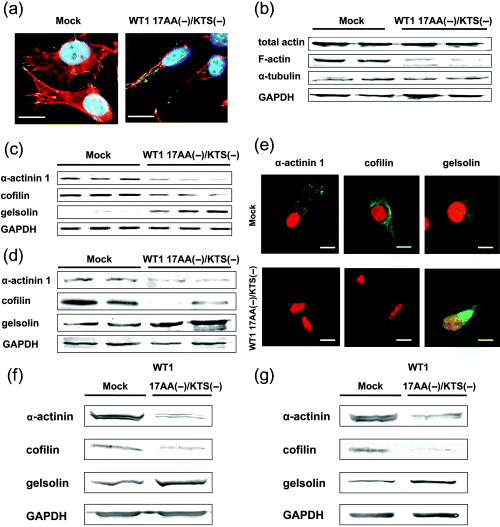
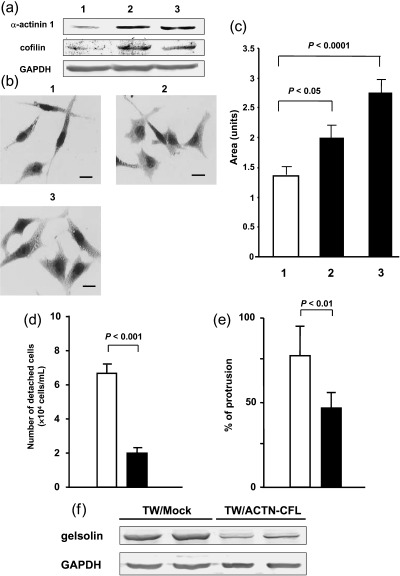
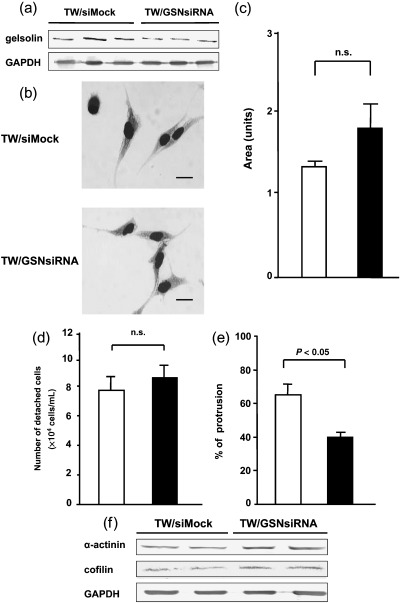
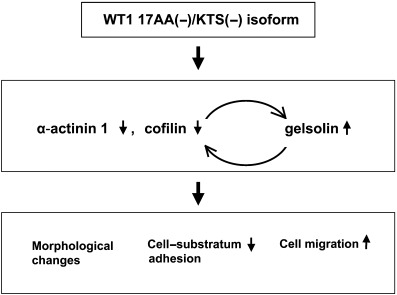
The wild-type Wilms' tumor gene WT1 is overexpressed in human primary leukemia and in a wide variety of solid cancers. All of the four WT1 isoforms are expressed in primary cancers and each is considered to have a different function. However, the functions of each of the WT1 isoforms in cancer cells remain unclear. The present study demonstrated that constitutive expression of the WT1 17AA(-)/KTS(-) isoform induces morphological changes characterized by a small-sized cell shape in TYK-nu.CP-r (TYK) ovarian cancer cells. In the WT1 17AA(-)/KTS(-) isoform-transduced TYK cells, cell-substratum adhesion was suppressed, and cell migration and in vitro invasion were enhanced compared to that in mock vector-transduced TYK cells. Constitutive expression of the WT1 17AA(-)/KTS(-) isoform also induced morphological changes in five (one gastric, one esophageal, two breast and one fibrosarcoma) of eight cancer cell lines examined. No WT1 isoforms other than the WT1 17AA(-)/KTS(-) isoform induced the phenotypic changes. A decrease in alpha-actinin 1 and cofilin expression and an increase in gelsolin expression were observed in WT1 17AA(-)/KTS(-) isoform-transduced TYK cells. In contrast, co-expression of alpha-actinin 1 and cofilin or knockdown of gelsolin expression by small interfering RNA restored WT1 17AA(-)/KTS(-) isoform-transduced TYK cells to a phenotype that was comparable to that of the parent TYK cells. These results indicated that the WT1 17AA(-)/KTS(-) isoform exerted its oncogenic functions through modulation of cytoskeletal dynamics. The present results may provide a novel insight into the signaling pathway of the WT1 gene for its oncogenic functions.


Figures

Figure 1
Figure 1
Induction of morphological changes in TYK‐nu.CP‐r (TYK) ovarian cancer cells by constitutive expression of the WT1 17AA(–)/KTS(–) isoform. (a) Representative results of western blot analysis on expression of the WT1 protein in four TYK cell clones, each transduced with a different WT1 isoform. (b) Representative results of stable expression of each of the WT1 isoforms in TYK cells. The cells were stained with MayGrünwald–Giemsa. Scale bars = 10 µm. (c) Means of relative areas of more than eight individual cells from three cell clones. Areas were calculated using NIH Image software.
Figure 2
Figure 2
Induction of morphological changes in various types of cancer cells by constitutive expression of the WT1 17AA(–)/KTS(–) isoform. (a) Green fluorescent protein (GFP)‐tagged WT1 17AA(–)/KTS(–) isoform was expressed transiently in various types of cancer cells such as ZR‐75, HT‐1080, MKN28, SKBr3 and TE10. Cells were analyzed morphologically using confocal microscopy 48–72 h after transfection. Upper panel, transparent images; lower panel, fluorescence images. Arrows indicate the cells expressing GFP‐tagged WT1 17AA(–)/KTS(–) protein. Scale bars = 10 µm. (b) Means of relative areas of more than nine individual cells. Areas were calculated using NIH Image software.
Figure 3
Figure 3
Suppression of cell–substratum adhesion by stable expression of the WT1 17AA(–)/KTS(–) isoform. WT1 17AA(–)/KTS(–) expression vector‐transduced or control vector‐transduced TYK cells were analyzed for (a) cell–substratum adhesion by cell attachment assay, and (b) strength of cell–substratum adhesion by cell detachment assay. Means of cell numbers of WT1 17AA(–)/KTS(–)‐transduced TYK cell clones (▪) and means of those of control vector‐transduced cell clones (□). Experiments were carried out independently three times for each cell line.
Figure 4
Figure 4
Enhancement of cell migration by constitutive expression of the WT1 17AA(–)/KTS(–) isoform. (a) Migration of individual green fluorescent protein (GFP)‐WT1 17AA(–)/KTS(–)‐expressing or ‐non‐expressing TYK cells was recorded using a time‐lapse video recorder at 2‐min intervals for 5 h. The velocity of the cells was calculated by the method described in ‘Materials and Methods’. Means of the velocity of GFP‐WT1 17AA(–)/KTS(–)‐expressing (▪) and ‐non‐expressing (□) cells. Bars indicate SE. Experiments were carried out independently ten times. (b,c) WT1 17AA(–)/KTS(–) expression vector‐ or control vector‐transduced TYK cells were analyzed for (b) collective migration by wound healing assay, and for (c) chemotaxis to 5% fetal bovine serum in Delbucco's modified Eagle's medium by transwell migration assay. (▪), WT1 17AA(–)/KTS(–) isoform‐transduced TYK cell clones; (□), control vector‐transduced TYK cell clones. Experiments were carried out independently three times for each cell clone. (b) Cell migration was determined as the mean of percentages of protrusive lengths to initial wound scratched lengths at three different sites. (c) Cells that invaded from the upper to lower chambers were stained with MayGrünwald–Giemsa and counted. (b–c) Scale bars = 50 µm.
Figure 5
Figure 5
Alteration of the expression of filamentous‐actin (F‐actin) and actin binding proteins (ABP) by constitutive expression of the WT1 17AA(–)/KTS(–) isoform. (a) WT1 17AA(–)/KTS(–) isoform‐transduced or control vector‐transduced TYK cells were stained immunocytochemically for F‐actin (red), the focal adhesion protein vinculin (green) and the nucleus (blue). (b) Cell lysates of control vector‐transduced (lanes 1 and 2) or WT1 17AA(–)/KTS(–) isoform‐transduced (lanes 3 and 4) independent cell clones were immunoblotted with antibodies specific for total actin, F‐actin, α‐tubulin or glyceraldehyde‐3‐phosphate dehydrogenase (GAPDH; used as a loading control). (c) Expression of mRNA of ABP in control vector‐transduced (n = 3, lanes 1–3) or WT1 17AA(–)/KTS(–) isoform‐transduced (n = 3, lanes 4–6) TYK cell clones isolated independently was analyzed by reverse transcription–polymerase chain reaction under the conditions shown in Table 1. (d) Cell lysates of control vector‐transduced (lanes 1 and 2) or WT1 17AA(–)/KTS(–) isoform‐transduced (lanes 3 and 4) TYK cell clones were immunoblotted with antibodies specific for α‐actinin 1, cofilin and gelsolin. (e) WT1 17AA(–)/KTS(–) isoform‐transduced or control vector‐transduced TYK cells were stained immunocytochemically for α‐actinin 1, cofilin and gelsolin (green). The nucleus of cells was stained with propidium iodide (red). (a,e) Scale bars = 10 µm. (f,g) Cell lysates of control vector‐transduced or WT1 17AA(–)/KTS(–) isoform‐transduced HT‐1080 (f) or TE10 (g) cell clones were immunoblotted with antibodies specific for α‐actinin 1, cofilin and gelsolin.
Figure 6
Figure 6
Stable expression of α‐actinin 1 and cofilin restores the phenotypes of TYK cells induced by transduction of the WT1 17AA(–)/KTS(–) isoform to those of parent TYK cells. WT1 17AA(–)/KTS(–) isoform‐transduced TYK cells were co‐transfected with α‐actinin 1 and cofilin expression vectors (TW/ACTN‐CFL) or a control vector (TW/Mock). (a) Expression levels of α‐actinin 1 and cofilin determined by western blot analysis. (b) Cells were stained with MayGrünwald–Giemsa. (c) Areas of cells calculated using NIH Image software. 1, TW/Mock cell clone; 2 and 3, different TW/ACTN‐CFL cell clones. Scale bars = 10 µm. (d) Cell–substratum adhesion determined by detachment assay. (e) Collective cell motility evaluated by wound healing assay. Cell migration was determined as the mean of percentages of protrusive lengths to initial wound scratched lengths at three different sites. (f) Expression levels of gelsolin determined by western blot analysis. (c–e) (▪), TW/ACTN‐CFL cells; (□), TW/Mock cells.
Figure 7
Figure 7
Suppression of gelsolin expression reduces cell migration but does not effect morphology or cell–substratum adhesion. WT1 17AA(–)/KTS(–) isoform‐transduced TYK cells were transduced with a gelsolin‐specific small interfering RNA (siRNA) vector (TW/GSNsiRNA) or control vector (TW/siMock). (a) Expression levels of gelsolin protein determined by western blot analysis. Three different cell clones were examined. (b) Cells were stained with MayGrünwald–Giemsa. Scale bars = 10 µm. (c) Areas of TW/Mock cell clone and TW/GSNsiRNA were calculated using NIH Image software. (d) Cell–substratum adhesion determined by detachment assay. (e) Collective cell motility evaluated by wound healing assay. (f) Expression levels of α‐actinin 1 and cofilin determined by western blot analysis. (c–e) (▪), Cell clones transduced with siRNA vector specific for gelsolin; (□), mock siRNA vector‐transduced cell clones.
Figure 8
Figure 8
The possible roles of the WT1 17AA(–)/KTS(–) isoform in the regulation of cytoskeletal dynamics. Constitutive expression of the WT1 17AA(–)/KTS(–) isoform downregulates the expression of both α‐actinin 1 and cofilin, and upregulates that of gelsolin. Moreover, α‐actinin 1/cofilin and gelsolin are mutually regulated in the downstream signaling of the WT1 17AA(–)/KTS(–) isoform. Thus, all or part of the functions of the WT1 17AA(–)/KTS(–) isoform (to induce morphological change, to decrease cell–substratum adhesion and to enhance cell migration) should operate through the regulation of α‐actinin 1/cofilin and gelsolin.

Similar articles

Cited by

References

    1. Call KM, Glaser T, Ito CY et al. Isolation and characterization of a zinc finger polypeptide gene at the human chromosome 11 Wilms’ tumor locus. Cell 1990; 60: 509–20. - PubMed
    1. Gashler AL, Bonthron DT, Madden SL, Rauscher FJ 3rd, Colins T, Sukhatme VP. Human platelet‐derived growth factor A chain is transcriptionally repressed by the Wilms tumor suppressor WT1. Proc Natl Acad Sci USA 1992; 89: 10 984–8. - PMC - PubMed
    1. Harrington MA, Konicek B, Song A, Xia XL, Fredericks WJ, Rauscher FJ 3rd. Inhibition of colony‐stimulating factor‐1 promoter activity by the product of the Wilms’ tumor locus. J Biol Chem 1993; 268: 21 271–5. - PubMed
    1. Drummond IA, Madden SL, Rohwer‐Nutter P, Bell GI, Sukhatme VP, Rauscher FJ 3rd. Repression of the insulin‐like growth factor II gene by the Wilms tumor suppressor WT1. Science 1992; 257: 674–8. - PubMed
    1. Werner H, Re GG, Drummond IA et al. Increased Expression of the insulin‐like growth factor I receptor gene, IGF1R, in Wilms tumor is correlated with modulation of IGF1R promoter activity by the WT1 Wilms tumor gene product. Proc Natl Acad Sci USA 1993; 90: 5828–32. - PMC - PubMed

Publication types