. 2006 Jun-Jul:216-217:176-88.
doi: 10.1016/j.heares.2006.03.011. Epub 2006 Apr 19.

Dorsal cochlear nucleus response properties following acoustic trauma: response maps and spontaneous activity

Affiliations

Dorsal cochlear nucleus response properties following acoustic trauma: response maps and spontaneous activity

Wei-Li Diana Ma et al. Hear Res. 2006 Jun-Jul.

Abstract

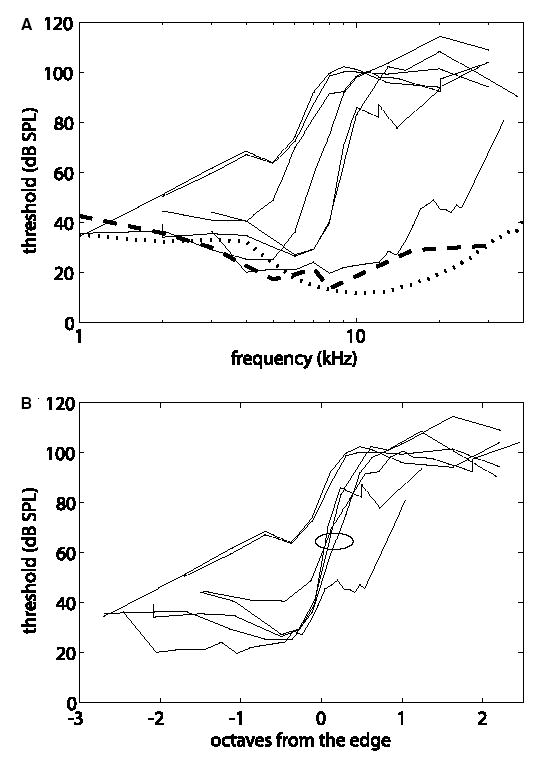
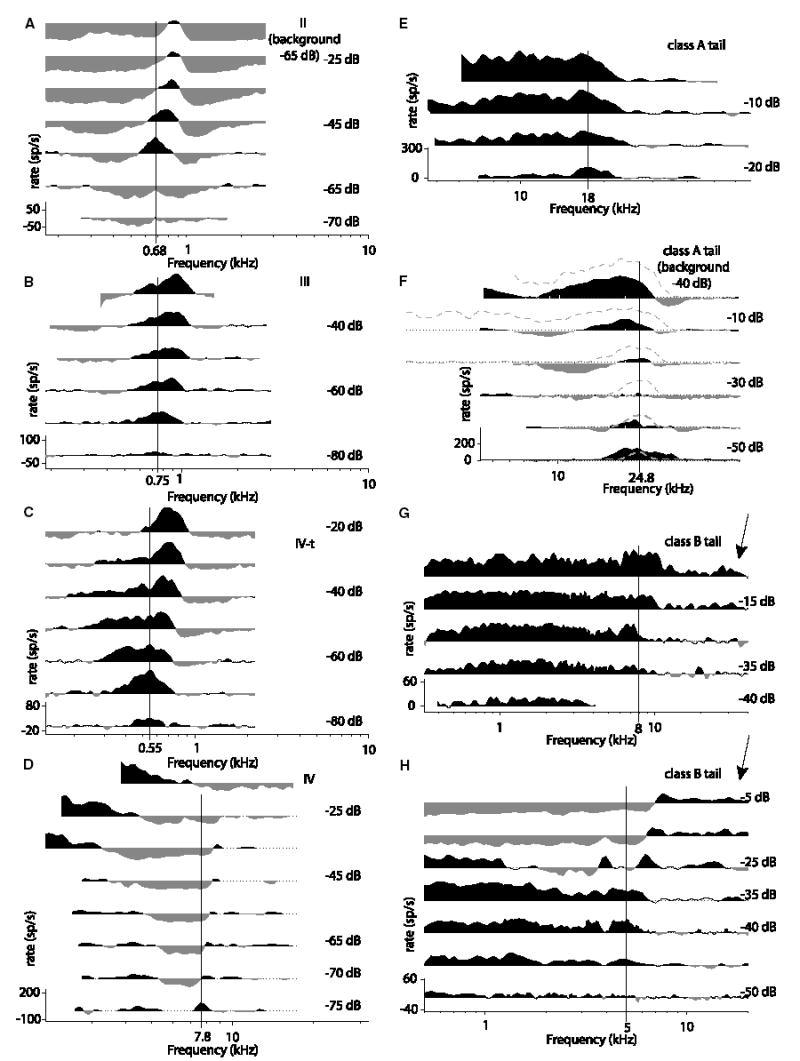
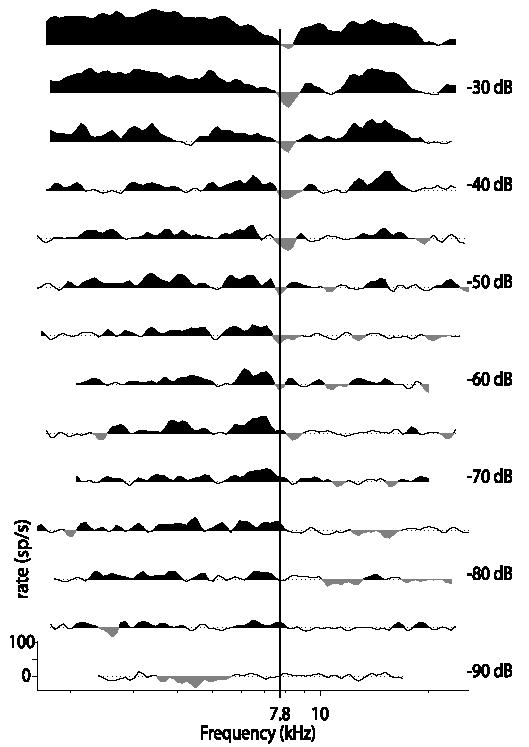
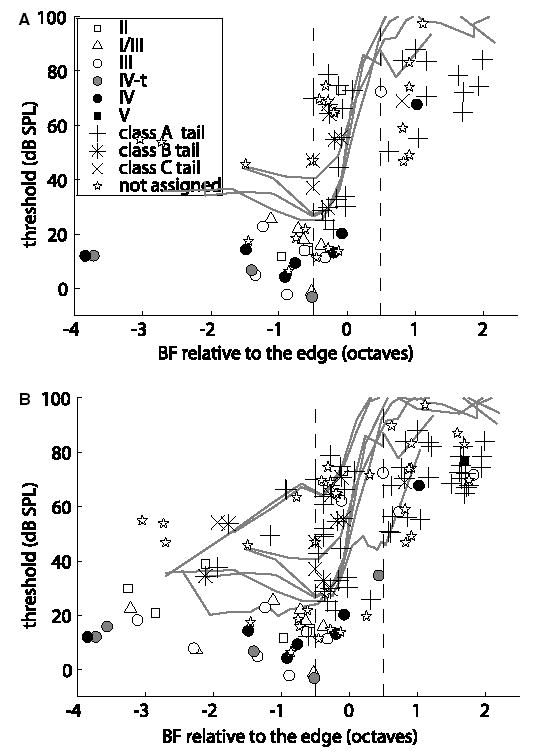
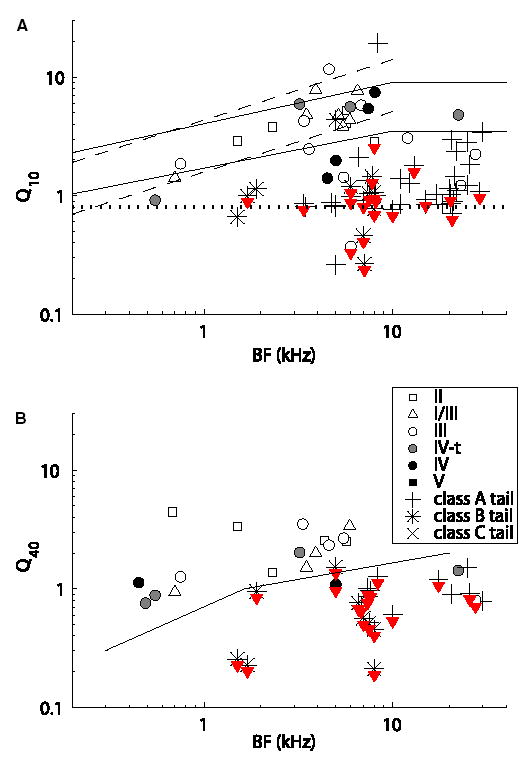
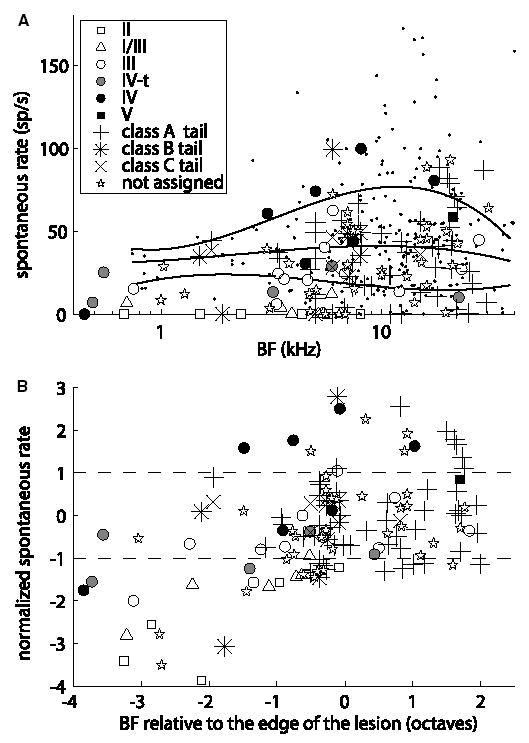
Recordings from single neurons in the dorsal cochlear nucleus (DCN) of unanesthetized (decerebrate) cats were done to characterize the effects of acoustic trauma. Trauma was produced by a 250 Hz band of noise centered at 10 kHz, presented at 105-120 dB SPL for 4h. After a one-month recovery period, neurons were recorded in the DCN. The threshold shift, determined from compound action-potential audiograms, showed a sharp threshold elevation of about 60 dB at BFs above an edge frequency of 5-10 kHz. The response maps of neurons with best frequencies (BFs) above the edge did not show the typical organization of excitatory and inhibitory areas seen in the DCN of unexposed animals. Instead, neurons showed no response to sound, weak responses that were hard to tune and characterize, or "tail" responses, consisting of broadly-tuned, predominantly excitatory responses, with a roughly low-pass shape similar to the tuning curves of auditory nerve fibers with similar threshold shifts. In some tail responses whose BFs were near the edge of the threshold elevation, a second weak high-frequency response was seen that suggests convergence of auditory nerve inputs with widely separated BFs on these cells. Spontaneous rates among neurons with elevated thresholds were not increased over those in populations of principal neurons in unexposed animals.


Figures

Fig. 1
Fig. 1
(A) CAP threshold functions for cats exposed to acoustic trauma (light solid lines), compared to thresholds from unexposed animals (dashed and dotted lines). CAP threshold is plotted versus frequency for CAPs studied at the beginning of each experiment. The heavy dashed line is from one unexposed animal studied in our lab; the dotted line is the average CAP audiogram from three animals reported by Rajan and Irvine (1998). (B) Threshold audiograms from the exposed cats shifted along the frequency axis to align the steepest portions of the audiograms. The abscissa is frequency relative to the steepest point, in octaves. The circle identifies four similar threshold functions; data from these experiments are shown separately in Fig. 4A.
Fig. 2
Fig. 2
Response maps of DCN neurons typical of non-exposed (left column) and exposed (right column) animals. Response maps show discharge rate versus frequency at a succession of fixed attenuations (the sound level at 0 dB attenuation is approximately 100 dB SPL). The horizontal lines are spontaneous rate or background rate in two-tone maps. The vertical solid lines show the BFs assigned to the neurons. Regions colored black are excitatory, meaning an increase in rate over spontaneous, and regions colored gray are inhibitory, meaning a decrease in rate. The maps are based on responses to one repetition of a 200 ms tone, so should be interpreted qualitatively. They have been smoothed with a three-point filter. For neurons without spontaneous activity, two-tone response maps are shown (A and F). In these cases, a second tone a few dB above threshold at the BF of the neuron was presented along with the response-map tone. The second tone produces enough background activity that inhibitory responses can be seen. (A) Type II two-tone map (the second tone was 0.68 kHz at −65 dB, 36 dB SPL).(B) Type III map. (C)Type IV-T map. (D) Type IV map. (E)Class A tail response map showing no clear inhibition for a neuron with spontaneous activity. (F) Class A tail response map showing inhibition; both single-tone (dashed line) and two-tone (filled map) response maps are shown. the horizontal line is the spontaneous rate (zero) for the single-tone map and is the driven background rate for the two-tone map. The second tone was 24.8 kHz at −40 dB, 72 dB SPL. (G) Class B tail response. Note the low level of activity extending to high frequencies at the highest level (arrow). (H) Class B tail response with inhibition.
Fig. 3
Fig. 3
Response map of a neuron that gave weak non-specific responses. Such neurons were not classified, although a BF could often be found, as here.
Fig. 4
Fig. 4
(A) Threshold at BF versus BF, plotted as octaves relative to the edge of the threshold shift. In most cases, thresholds were obtained from rate versus level functions for BF tones in 1 dB intensity steps. Only data from the four experiments with similar sharp threshold shifts, circled in 1B, are shown. CAP threshold audiograms are plotted in light gray. Symbols define different response map types, defined in the legend. “not assigned” means neurons in which the BF could be determined, but the response type could not. The dashed lines mark the edge region, from −0.5 to 0.5 octave relative to the steepest point on the threshold functions. (B) The same plot using data from all seven animals.
Fig. 5
Fig. 5
Bandwidths of excitatory response areas plotted as Q values, defined as BF/bandwidth. The bandwidth is for excitatory responses only and bandwidths were not measured at sound levels where inhibitory areas encroached on BF. The legend identifies response types. (A) Q10, based on bandwidth 10 dB above threshold. The shaded down-pointing triangles are plotted just below points for which the bandwidth was not fully determined in the response map, usually because the frequencies studied did not extend far enough at the low frequency end. In these cases, the Q value is actually less than the position plotted. The dashed lines bound the Q10 data in auditory-nerve fibers from unexposed cats (Miller et al., 1997) and the solid lines are from Liberman and Dodds (1984). The dotted line shows the minimum Q10 in auditory-nerve fibers with 40–60 dB threshold elevation from acoustic trauma, also from Miller et al. (1997). (B) Q40, based on bandwidth 40 dB above threshold. The line is a lower bound on auditory nerve (Liberman, 1978) and DCN (Young and Voigt, 1982) values in unexposed cats.
Fig. 6
Fig. 6
(A) Spontaneous rate plotted versus BF for all neurons with BFs in the seven experiments. The symbols identify response map types and are defined in the legend. The dots show spontaneous rates of type III, IV-T, and IV neurons from three previous studies in non-exposed animals, as a comparison. The median rates and 20th and 80th percentiles were determined from the comparison group in non-overlapping 1/3 octave bins. The lines are best-fitting third-order polynomials (as rate versus log(BF)) fit to the medians and quintiles. (B) Spontaneous rates for the data from the seven experiments plotted versus BF, on a scale of octaves re the edge of the threshold shift. The rate scale is normalized to the smoothed medians and quintiles from A, such that the ordinate in B is (rate − median rate)/|quintile rate − median rate|. The 20% line was used for rate < median and the 80% line was used for rate > median. The medians and quintile were computed from the polynomials shown in A. The horizontal dashed lines should contain 60% of the data in any group of neurons with a spontaneous rate distribution similar to the comparison data.

Similar articles

Cited by

References

    1. Abbott SD, Hughes LF, Bauer CA, Salvi R, Caspary DM. Detection of glutamate decarboxylase isoforms in rat inferior colliculus following acoustic exposure. Neuroscience. 1999;93:1375–1381. - PubMed
    1. Anderson MJ, Young ED. Isoflurane/N2O anesthesia suppresses narrowband but not wideband inhibition in dorsal cochlear nucleus. Hear Res. 2004;188:29–41. - PubMed
    1. Berrebi AS, Mugnaini E. Distribution and targets of the cartwheel cell axon in the dorsal cochlear nucleus of the guinea pig. Anat Embryol. 1991;183:427–454. - PubMed
    1. Bilak M, Kim J, Potashner SJ, Bohne BA, Morest DK. New growth of axons in the cochlear nucleus of adult chinchillas after acoustic trauma. Exp Neurol. 1997;147:256–268. - PubMed
    1. Bledsoe SC, Jr, Nagase S, Miller JM, Altschuler RA. Deafness-induced plasticity in the mature central auditory system. Neuroreport. 1995;7:225–229. - PubMed

Publication types