. 2006 Jul 15;31(4):1513-24.
doi: 10.1016/j.neuroimage.2006.02.027. Epub 2006 May 2.

A cortical potential imaging study from simultaneous extra- and intracranial electrical recordings by means of the finite element method

Affiliations

A cortical potential imaging study from simultaneous extra- and intracranial electrical recordings by means of the finite element method

Yingchun Zhang et al. Neuroimage. .

Abstract

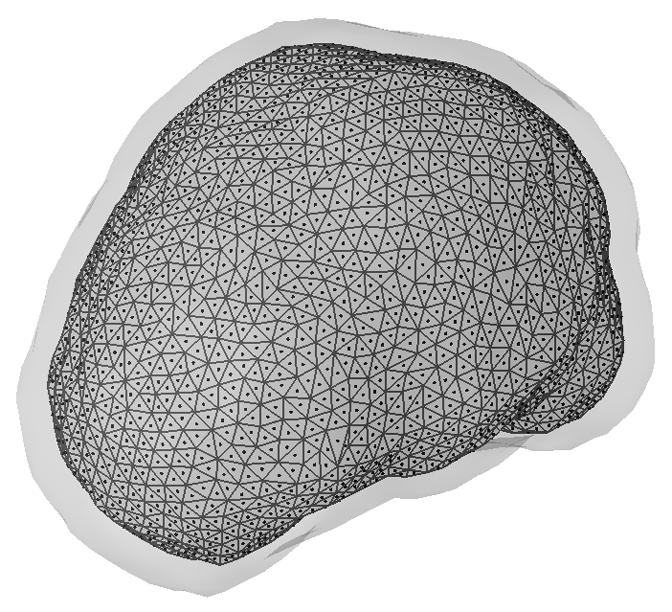
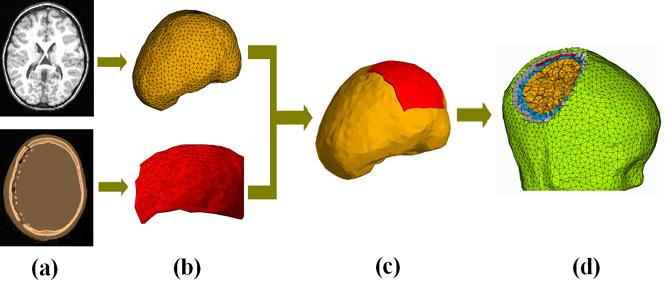
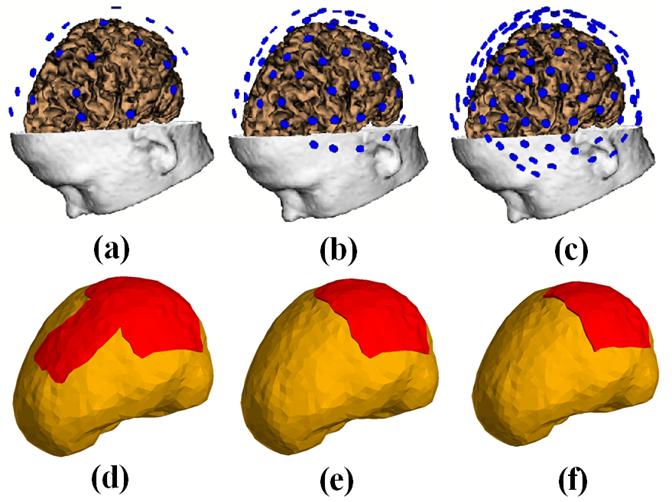
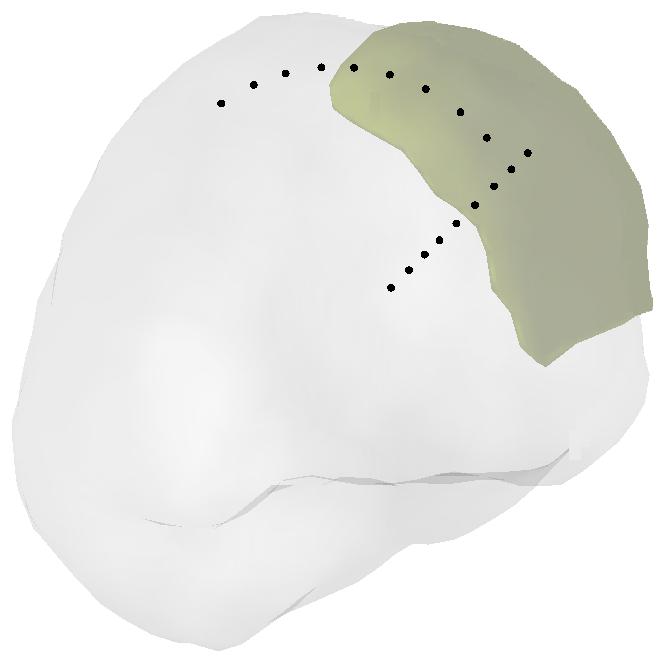
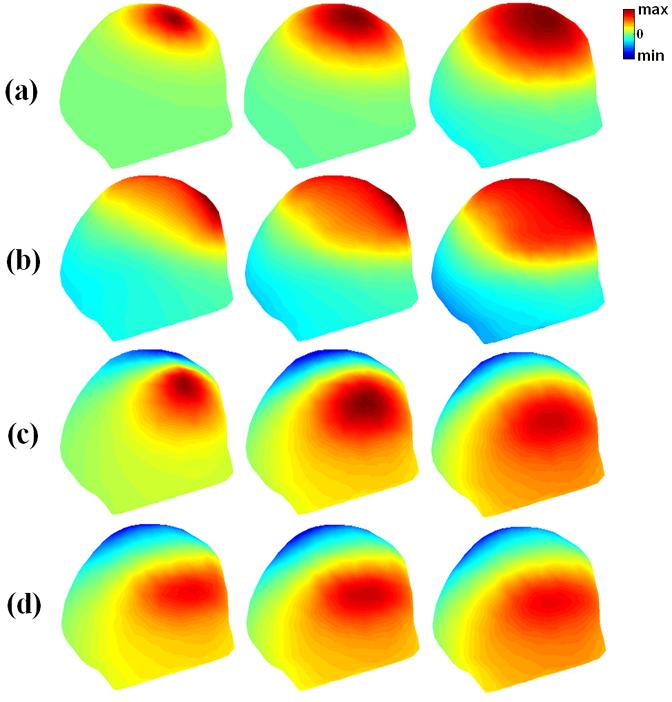
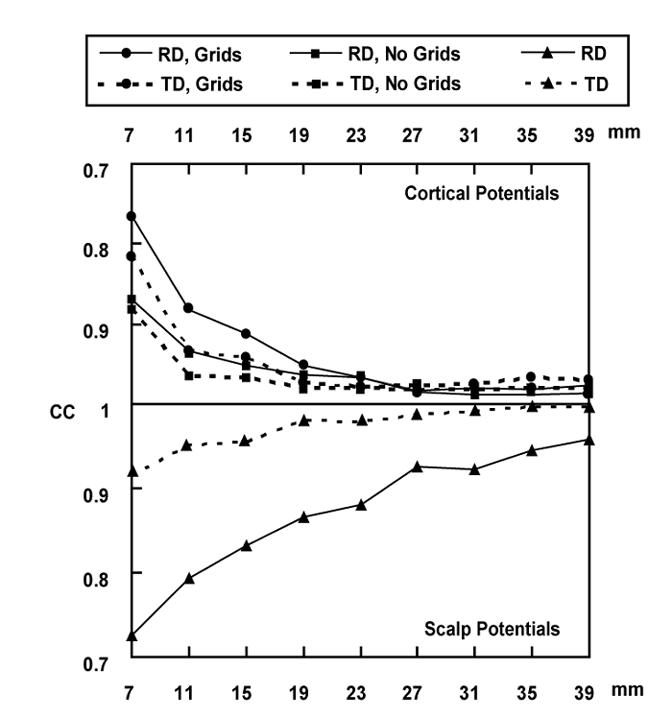
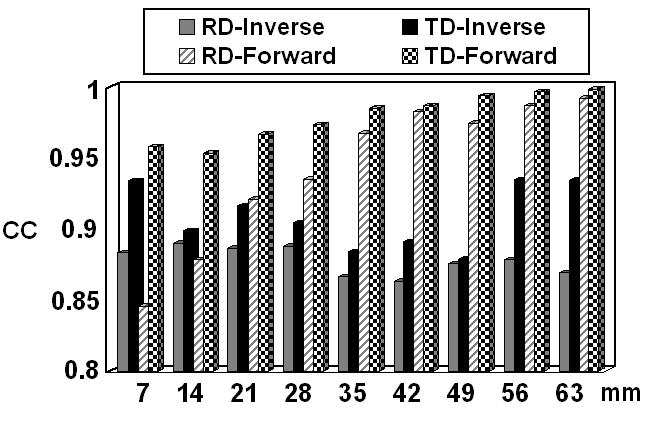
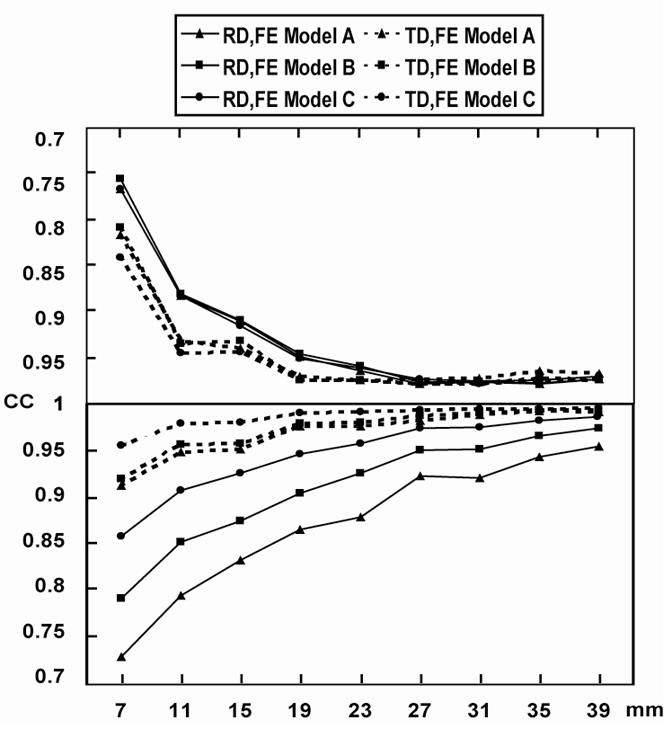
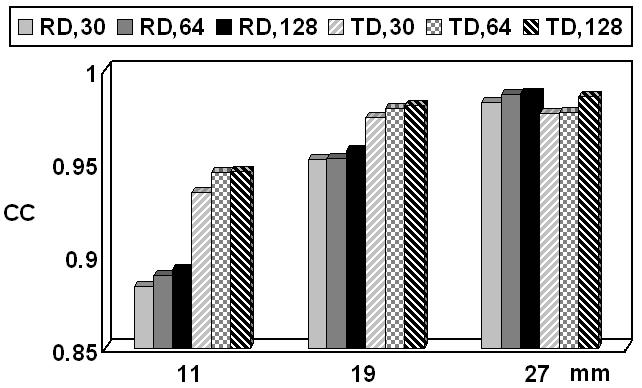
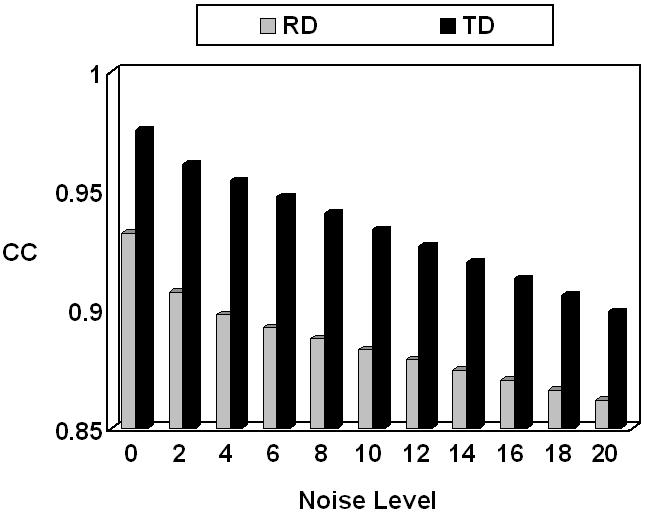
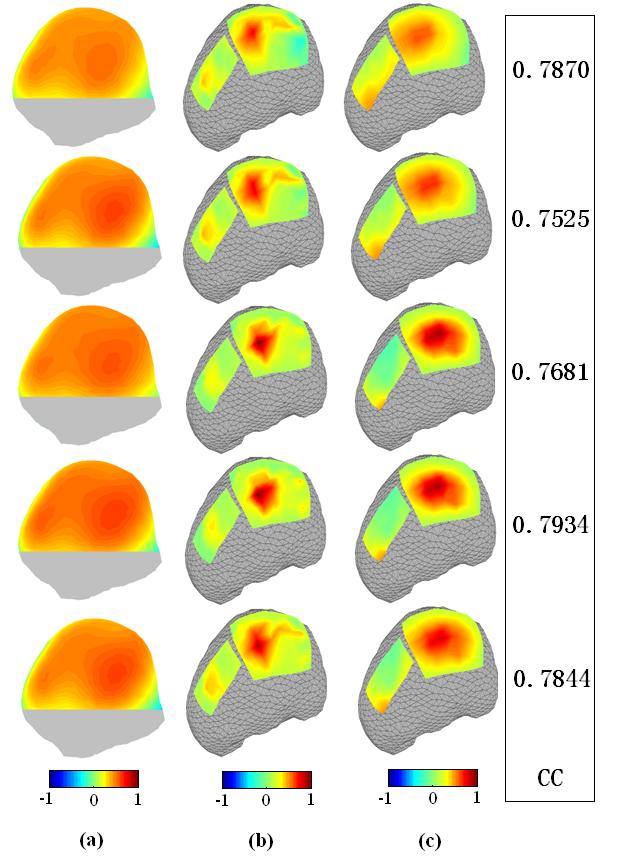
In the present study, we have validated the cortical potential imaging (CPI) technique for estimating cortical potentials from scalp EEG using simultaneously recorded electrocorticogram (ECoG) in the presence of strong local inhomogeneity, i.e., Silastic ECoG grid(s). The finite element method (FEM) was used to model the realistic postoperative head volume conductor, which includes the scalp, skull, cerebrospinal fluid (CSF) and brain, as well as the Silastic ECoG grid(s) implanted during the surgical evaluation in epilepsy patients, from the co-registered magnetic resonance (MR) and computer tomography (CT) images. A series of computer simulations were conducted to evaluate the present FEM-based CPI technique and to assess the effect of the Silastic ECoG grid on the scalp EEG forward solutions. The present simulation results show that the Silastic ECoG grid has substantial influence on the scalp potential forward solution due to the distortion of current pathways in the presence of the extremely low conductive materials. On the other hand, its influence on the estimated cortical potential distribution is much less than that on the scalp potential distribution. With appropriate numerical modeling and inverse estimation techniques, we have demonstrated the feasibility of estimating the cortical potentials from the scalp EEG with the implanted Silastic ECoG gird(s), in both computer simulations and in human experimentation. In an epilepsy patient undergoing surgical evaluation, the cortical potentials were reconstructed from the simultaneously recorded scalp EEG, in which main features of spatial patterns during interictal spike were preserved and over 0.75 correlation coefficient value was obtained between the recorded and estimated cortical potentials. The FEM-based CPI technique provides a means of connecting the simultaneous recorded ECoG and the scalp EEG and promises to become an effective tool to evaluate and validate CPI techniques using clinic data.


Figures

Fig. 1
Fig. 1
Illustration of the equivalent dipole layer (the inner surface with triangles) underneath the epicortical surface (the outer gray surface). Dots refer to locations of the dipoles over the equivalent dipole layer.
Fig. 2
Fig. 2
Schematic diagram illustrating the procedure to construct the finite element model. (a) MRI and CT slice; (b) the triangulated surface model of the brain built from MRI and the triangulated surface model of the Silastic strip ECoG grid built from CT images; (c) the volume model consisting of both the brain and Silastic strip ECoG grid after co-registration; (d) the finite element model consisting of the scalp (green), skull (gray), CSF (blue), brain (yellow) and Silastic strips ECoG grid (red).
Fig. 3
Fig. 3
The configurations of scalp electrodes ((a): 30 electrodes; (b) 64 electrodes; and (c) 128 electrodes) after coregistration, and three kinds of Silastic ECoG grid(s) with different sizes ((d) one 80 mm by 80mm grid plus a 40 mm by 80 mm grid; (e) one 80 mm by 80 mm grid; (f) one 60 mm by 60 mm grid). The ECoG grid is illustrated by red.
Fig. 4
Fig. 4
Locations of simulated dipoles. Two groups of dipole locations were considered in the computer simulations. The 1st group consisted of 9 dipoles placed from 7 mm to 39 mm evenly below the center of the Silastic ECoG grid. The 2nd group consisted of 10 dipoles placed 11 mm below the Silastic ECoG grid and distributed along the cortical surface away from the center of the grid to the edge of the grid and the 1st dipole in the 2nd dipole group shares the same position with the 2nd dipole in the 1st dipole group.
Fig. 5
Fig. 5
The simulated scalp potential distributions with or without Silastic ECoG grids (model shown in Fig. 3(d)). Three dipole locations in the 1st dipole group, 7mm, 23mm, and 39mm, were used and shown on the left, middle, and right column, respectively. (a)-(b) show scalp potential distributions due to a radial dipole; and (c)-(d) show scalp potential distributions due to a tangential dipole. (a) and (c) refer to scalp potential distributions without the ECoG grids; and (b) and (d) refer to the potential distributions with the ECoG grids. Note the substantial effect of the ECoG grids on the scalp potential distributions due to radial dipole.
Fig. 6
Fig. 6
Upper panel: Correlation coefficient (CC) between the simulated cortical potentials and the FEM-CPI reconstructed cortical potentials, produced by the dipoles in the 1st dipole group located in the finite element model A, with or without ECoG grids. Lower panel: CC between the potentials at 30 scalp electrodes produced by dipoles in the 1st dipole group located in the finite element model A, with and without ECoG grids.
Fig. 7
Fig. 7
Solid bars: CC between the simulated cortical potentials and the FEM-CPI reconstructed cortical potentials, produced by the dipoles in the 2nd dipole group (not including the 1st dipole because it shares the same position with the 2nd dipole in the 1st dipole group) located in the finite element model A, with ECoG grids. Shaded bars: CC between the potentials at 30 scalp electrodes produced by dipoles in the 2nd dipole group located in the finite element model A, with and without the ECoG grids.
Fig. 8
Fig. 8
Upper panel: CC between the simulated cortical potentials and the FEM-CPI reconstructed cortical potentials produced by dipoles in the 1st dipole group located in the finite element models A, B and C (see Fig. 3(d-f)). Lower panel: CC between the potentials at 30 scalp electrodes, produced by dipoles in the 1st dipole group, located in the finite element models A, B and C (see Fig. 3(d-f)).
Fig. 9
Fig. 9
CC between the simulated cortical potentials and the FEM-CPI reconstructed cortical potentials obtained from scalp EEG recordings with different electrode numbers, produced by the 2nd, 4th and 6th dipole in the 1st dipole group located in the finite element model A.
Fig. 10
Fig. 10
CC between the simulated cortical potential and the FEM-CPI reconstructed cortical potential at different noise levels, produced by the 3rd dipole in the 1st dipole group located in the finite element model A.
Fig. 11
Fig. 11
Comparison between the ECoG recordings (b) and the reconstructed cortical potentials (c) at different time points during an interictal spike of a pediatric epilepsy patient, from 5 ms before and 5 ms after the peak of the spike. (a) shows the corresponding scalp potential distributions from 30 electrode recordings. CCs between ECoG recordings and the reconstructed cortical potentials on the ECoG grids are listed on the right. Note the much smoothed spatial distribution of the scalp EEG due to the Silastic ECoG grid, and the good performance of the present FEM-CPI in reconstructing the major features of the cortical potentials.

References

    1. Babiloni F, Babiloni C, Carducci F, Fattorini L, Anello C, Onorati P, Urbano A. High resolution EEG: A new model-dependent spatial deblurring method using a realisticallyshaped MR-constructed subject’s head model. Electroenceph. Clin. Neurophysiol. 1997;102:69–80. - PubMed
    1. Babiloni F, Babiloni C, Carducci F, Romani GL, Rossini PM, Angelone LM, Cincotti F. Multimodal integration of high-resolution EEG and functional magnetic resonance imaging data: a simulation study. Neuroimage. 2003;19:1–15. - PubMed
    1. Cohen D, Cuffin BN, Yunokuchi K, Maniewski R, Purcell C, Cosgrove GR, Ives J, Kennedy JG, Schomer DL. MEG versus EEG localization test using implanted sources in the human brain. Ann Neurol. 1990;28:811–817. - PubMed
    1. Cuffin BN, Cohen D. Comparison of the magnetoencephalogram and electroencephalogram. Electroencephalogr. Clin. Neurophysiol. 1979;47:132–146. - PubMed
    1. Dale AM, Sereno MI. Improved localization of cortical activity by combining EEG and MEG with MRI cortical surface reconstruction: a linear approach. J. Cognit. Neurosci. 1993;5:162–176. - PubMed

Publication types