

A review of the application of propensity score methods yielded increasing use, advantages in specific settings, but not substantially different estimates compared with conventional multivariable methods
- PMID: 16632131
- PMCID: PMC1448214
- DOI: 10.1016/j.jclinepi.2005.07.004
A review of the application of propensity score methods yielded increasing use, advantages in specific settings, but not substantially different estimates compared with conventional multivariable methods
Abstract
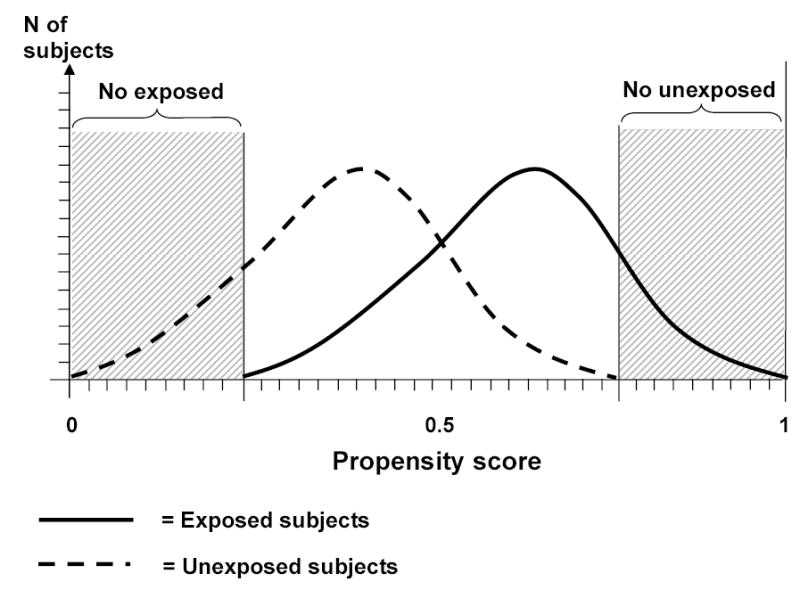
Objective: Propensity score (PS) analyses attempt to control for confounding in nonexperimental studies by adjusting for the likelihood that a given patient is exposed. Such analyses have been proposed to address confounding by indication, but there is little empirical evidence that they achieve better control than conventional multivariate outcome modeling.
Study design and methods: Using PubMed and Science Citation Index, we assessed the use of propensity scores over time and critically evaluated studies published through 2003.
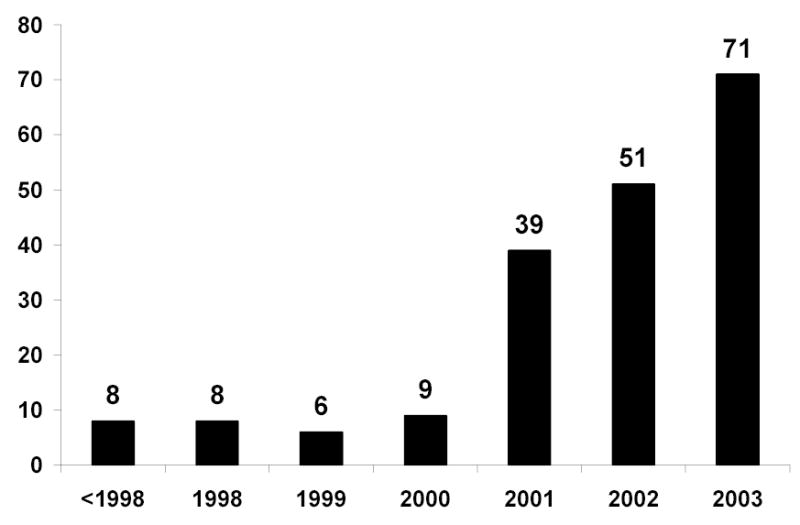
Results: Use of propensity scores increased from a total of 8 reports before 1998 to 71 in 2003. Most of the 177 published studies abstracted assessed medications (N=60) or surgical interventions (N=51), mainly in cardiology and cardiac surgery (N=90). Whether PS methods or conventional outcome models were used to control for confounding had little effect on results in those studies in which such comparison was possible. Only 9 of 69 studies (13%) had an effect estimate that differed by more than 20% from that obtained with a conventional outcome model in all PS analyses presented.
Conclusions: Publication of results based on propensity score methods has increased dramatically, but there is little evidence that these methods yield substantially different estimates compared with conventional multivariable methods.
Figures
References
-
- Writing group for the Women’s Health Initiative investigators. Risk and benefits of estrogen plus progestin in healthy postmenopausal women. Principal results from the Women’s Health Initiative randomized controlled trial. JAMA. 2002;288:321–333. - PubMed
-
- Walker AM. Confounding by indication. Epidemiology. 1996;7:335–336. - PubMed
-
- Miettinen OS. Stratification by a multivariate confounder score. Am J Epidemiol. 1976;104:609–620. - PubMed
-
- Rosenbaum PR, Rubin DB. The central role of the propensity score in observational studies for causal effects. Biometrika. 1983;70:41–55.
Publication types
MeSH terms
Grants and funding
LinkOut - more resources
Full Text Sources
