Gap-junctional single-channel permeability for fluorescent tracers in mammalian cell cultures
- PMID: 16632504
- PMCID: PMC1483098
- DOI: 10.1529/biophysj.105.072306
Gap-junctional single-channel permeability for fluorescent tracers in mammalian cell cultures
Abstract
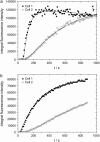
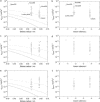
We have developed a simple dye transfer method that allows quantification of the gap-junction permeability of small cultured cells. Fluorescent dyes (calcein and Lucifer yellow) were perfused into one cell of an isolated cell pair using a patch-type micropipette in the tight-seal whole cell configuration. Dye spreading into the neighboring cells was monitored using a low-light charge-coupled device camera. Permeation rates for calcein and Lucifer yellow were then estimated by fitting the time course of the fluorescence intensities in both cells. For curve fitting, we used a set of model equations derived from a compartment model of dye distribution. The permeation rates were correlated to the total ionic conductance of the gap junction measured immediately after the perfusion experiment. Assuming that dye permeation is through a unit-conductance channel, we were then able to calculate the single-channel permeance for each tracer dye. We have applied this technique to HeLa cells stably transfected with rat-Cx46 and Cx43, and to BICR/M1R(k) cells, a rat mammary tumor cell line that has very high dye coupling through endogenous Cx43 channels. Scatter plots of permeation rates versus junctional conductance did not show a strictly linear correlation of ionic versus dye permeance, as would have been expected for a simple pore. Instead, we found that the data scatter within a wide range of different single-channel permeances. In BICR/M1R(k) cells, the lower limiting single-channel permeance is 2.2 +/- 2.0 x 10(-12) mm3/s and the upper limit is 50 x 10(-12) mm3/s for calcein and 6.8 +/- 2.8 x 10(-12) mm3/s and 150 x 10(-12) mm3/s for Lucifer yellow, respectively. In HeLa-Cx43 transfectants we found 2.0 +/- 2.4 x 10(-12) mm3/s and 95 x 10(-12) mm3/s for calcein and 2.1 +/- 6.8 x 10(-12) mm3/s and 80 x 10(-12) mm3/s for Lucifer yellow, and in HeLa-Cx46 transfectants 1.7 +/- 0.3 x 10(-12) mm3/s and 120 x 10(-12) mm3/s for calcein and 1.3 +/- 1.1 x 10(-12) mm3/s and 34 x 10(-12) mm3/s for Lucifer yellow, respectively. This variability is most likely due to a yet unknown mechanism that differentially regulates single-channel permeability for larger molecules and for small inorganic ions.
Figures


Similar articles
-
Connexin43 and connexin45 form heteromeric gap junction channels in which individual components determine permeability and regulation.Circ Res. 2002 May 31;90(10):1100-7. doi: 10.1161/01.res.0000019580.64013.31. Circ Res. 2002. PMID: 12039800
-
Specific permeability and selective formation of gap junction channels in connexin-transfected HeLa cells.J Cell Biol. 1995 May;129(3):805-17. doi: 10.1083/jcb.129.3.805. J Cell Biol. 1995. PMID: 7537274 Free PMC article.
-
Transfected connexin45 alters gap junction permeability in cells expressing endogenous connexin43.J Cell Biol. 1995 Aug;130(4):987-95. doi: 10.1083/jcb.130.4.987. J Cell Biol. 1995. PMID: 7642714 Free PMC article.
-
Emerging issues of connexin channels: biophysics fills the gap.Q Rev Biophys. 2001 Aug;34(3):325-472. doi: 10.1017/s0033583501003705. Q Rev Biophys. 2001. PMID: 11838236 Review.
-
[Remodeling of cardiac gap junctions and arrhythmias].Sheng Li Xue Bao. 2011 Dec 25;63(6):586-92. Sheng Li Xue Bao. 2011. PMID: 22193455 Review. Chinese.
Cited by
-
Beta cells preferentially exchange cationic molecules via connexin 36 gap junction channels.Diabetologia. 2007 Nov;50(11):2332-41. doi: 10.1007/s00125-007-0807-9. Epub 2007 Sep 8. Diabetologia. 2007. PMID: 17828386
-
Connexin Hemichannels: Methods for Dye Uptake and Leakage.J Membr Biol. 2016 Dec;249(6):713-741. doi: 10.1007/s00232-016-9925-y. Epub 2016 Sep 1. J Membr Biol. 2016. PMID: 27586664
-
Functional analysis of hemichannels and gap-junctional channels formed by connexins 43 and 46.Mol Vis. 2010 Jul 15;16:1343-52. Mol Vis. 2010. PMID: 20664797 Free PMC article.
-
Neurons and β-cells of the pancreas express connexin36, forming gap junction channels that exhibit strong cationic selectivity.J Membr Biol. 2012 Jun;245(5-6):243-53. doi: 10.1007/s00232-012-9445-3. Epub 2012 Jun 30. J Membr Biol. 2012. PMID: 22752717 Free PMC article.
-
Cx43 Channel Gating and Permeation: Multiple Phosphorylation-Dependent Roles of the Carboxyl Terminus.Int J Mol Sci. 2018 Jun 4;19(6):1659. doi: 10.3390/ijms19061659. Int J Mol Sci. 2018. PMID: 29867029 Free PMC article.
References
-
- Stewart, W. W. 1978. Functional connections between cells as revealed by dye-coupling with a highly fluorescent naphthalimide tracer. Cell. 14:741–759. - PubMed
-
- Mobbs, P., D. Becker, R. Williamson, M. Bate, and A. Warner. 1994. Techniques for dye injection and cell labeling. In Microelectrode Techniques. The Plymouth Workshop Handbook, 2nd ed. D. C. Ogden, editor. The Company of Biologists Ltd., Cambridge, UK. 361–387.
-
- Simpson, I., B. Rose, and W. R. Loewenstein. 1977. Size limit of molecules permeating the junctional membrane channels. Science. 195:294–296. - PubMed
-
- Schwarzmann, G., H. Wiegandt, B. Rose, A. Zimmerman, D. Ben-Haim, and W. R. Loewenstein. 1981. Diameter of the cell-to cell junctional membrane channels as probed with neutral molecules. Science. 213:551–553. - PubMed
-
- Flagg-Newton, J., I. Simpson, and W. R. Loewenstein. 1979. Permeability of the cell-to-cell membrane channels in mammalian cell junction. Science. 205:404–407. - PubMed
Publication types
MeSH terms
Substances
LinkOut - more resources
Full Text Sources
Miscellaneous

