Inhibition of cAMP-dependent protein kinase under conditions occurring in the cardiac dyad during a Ca2+ transient
- PMID: 16632511
- PMCID: PMC1483070
- DOI: 10.1529/biophysj.106.083931
Inhibition of cAMP-dependent protein kinase under conditions occurring in the cardiac dyad during a Ca2+ transient
Abstract
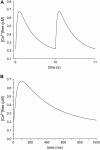
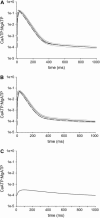
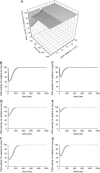
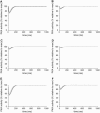
The space between the t-tubule invagination and the sarcoplasmic reticulum (SR) membrane, the dyad, in ventricular myocytes has been predicted to experience very high [Ca2+] for short periods of time during a Ca2+ transient. The dyadic space accommodates many protein kinases responsible for the regulation of Ca2+ handling proteins of the cell. We show in vitro that cAMP-dependent protein kinase (PKA) is inhibited by high [Ca2+] through a shift in the ratio of CaATP/MgATP toward CaATP. We further generate a three-dimensional mathematical model of Ca2+ and ATP diffusion within dyad. We use this model to predict the extent to which PKA would be inhibited by an increased CaATP/MgATP ratio during a Ca2+ transient in the dyad in vivo. Our results suggest that under normal physiological conditions a myocyte paced at 1 Hz would experience up to 55% inhibition of PKA within the cardiac dyad, with inhibition averaging 5% throughout the transient, an effect which becomes more pronounced as the myocyte contractile frequency increases (at 7 Hz, PKA inhibition averages 28% across the dyad throughout the duration of a Ca2+ transient).
Figures


Similar articles
-
Sex differences in SR Ca(2+) release in murine ventricular myocytes are regulated by the cAMP/PKA pathway.J Mol Cell Cardiol. 2014 Oct;75:162-73. doi: 10.1016/j.yjmcc.2014.07.006. Epub 2014 Jul 24. J Mol Cell Cardiol. 2014. PMID: 25066697
-
Ca2+-regulated-cAMP/PKA signaling in cardiac pacemaker cells links ATP supply to demand.J Mol Cell Cardiol. 2011 Nov;51(5):740-8. doi: 10.1016/j.yjmcc.2011.07.018. Epub 2011 Jul 28. J Mol Cell Cardiol. 2011. PMID: 21835182 Free PMC article.
-
Protein kinase A phosphorylation of the ryanodine receptor does not affect calcium sparks in mouse ventricular myocytes.Circ Res. 2002 Feb 22;90(3):309-16. doi: 10.1161/hh0302.105660. Circ Res. 2002. PMID: 11861420
-
High basal protein kinase A-dependent phosphorylation drives rhythmic internal Ca2+ store oscillations and spontaneous beating of cardiac pacemaker cells.Circ Res. 2006 Mar 3;98(4):505-14. doi: 10.1161/01.RES.0000204575.94040.d1. Epub 2006 Jan 19. Circ Res. 2006. PMID: 16424365
-
Roles for the sarco-/endoplasmic reticulum in cardiac myocyte contraction, protein synthesis, and protein quality control.Physiology (Bethesda). 2012 Dec;27(6):343-50. doi: 10.1152/physiol.00034.2012. Physiology (Bethesda). 2012. PMID: 23223628 Review.
Cited by
-
Mitochondrial membrane permeabilization and cell death during myocardial infarction: roles of calcium and reactive oxygen species.Future Cardiol. 2012 Nov;8(6):863-84. doi: 10.2217/fca.12.58. Future Cardiol. 2012. PMID: 23176689 Free PMC article. Review.
-
Oxidation of RyR2 Has a Biphasic Effect on the Threshold for Store Overload-Induced Calcium Release.Biophys J. 2016 Jun 7;110(11):2386-2396. doi: 10.1016/j.bpj.2016.04.036. Biophys J. 2016. PMID: 27276257 Free PMC article.
-
Excitation-contraction coupling and mitochondrial energetics.Basic Res Cardiol. 2007 Sep;102(5):369-92. doi: 10.1007/s00395-007-0666-z. Epub 2007 Jul 27. Basic Res Cardiol. 2007. PMID: 17657400 Free PMC article. Review.
References
-
- Bers, D. M. 2002. Cardiac excitation-contraction coupling. Nature. 415:198–205. - PubMed
-
- Berne, R. M., and M. N. Levy. 1993. Physiology. Mosby Year Book, St. Louis, MO.
-
- Shannon, T. R., and D. M. Bers. 2004. Integrated Ca2+ management in cardiac myocytes. Ann. N. Y. Acad. Sci. 1015:28–38. - PubMed
-
- Fabiato, A. 1983. Calcium-induced release of calcium from the cardiac sarcoplasmic reticulum. Am. J. Physiol. 245:C1–14. - PubMed
Publication types
MeSH terms
Substances
LinkOut - more resources
Full Text Sources
Research Materials
Miscellaneous

