

Expression profiling the developing mammalian enteric nervous system identifies marker and candidate Hirschsprung disease genes
- PMID: 16632597
- PMCID: PMC1458994
- DOI: 10.1073/pnas.0602152103
Expression profiling the developing mammalian enteric nervous system identifies marker and candidate Hirschsprung disease genes
Abstract
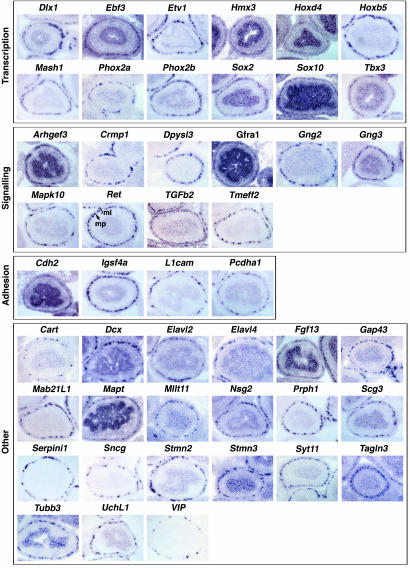
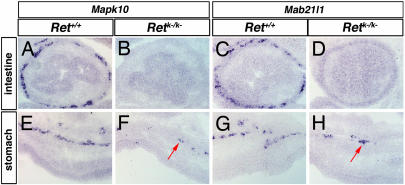
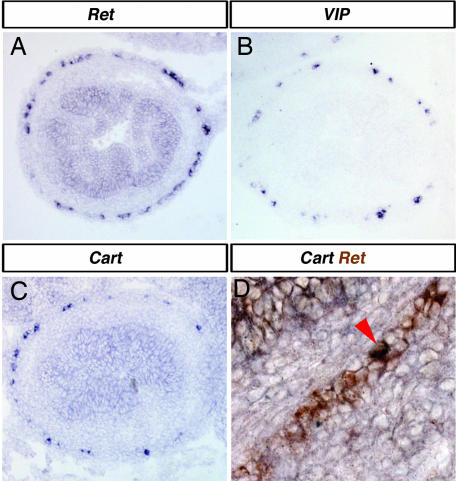
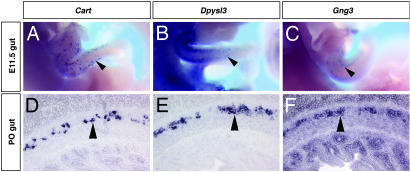
The enteric nervous system (ENS) is composed of neurons and glial cells, organized as interconnected ganglia within the gut wall, which controls peristalsis of the gut wall and secretions from its glands. The Ret receptor tyrosine kinase is expressed throughout enteric neurogenesis and is required for normal ENS development; humans with mutations in the RET locus have Hirschsprung disease (HSCR, an absence of ganglia in the colon), and mice lacking Ret have total intestinal aganglionosis. The Ret mutant mouse provides a tool for identifying genes implicated in development of the ENS. By using RNA from WT and Ret mutant (aganglionic) gut tissue and DNA microarrays, we have conducted a differential screen for ENS-expressed genes and have identified hundreds of candidate ENS-expressed genes. Forty-seven genes were selected for further analysis, representing diverse functional classes. We show that all of the analyzed genes are expressed in the ENS and that the screen was sensitive enough to identify genes marking only subpopulations of ENS cells. Our screen, therefore, was reliable and sensitive and has identified many previously undescribed genes for studying ENS development. Moreover, two of the genes identified in our screen Arhgef3 and Ctnnal1, have human homologues that map to previously identified HSCR susceptibility loci, thus representing excellent candidates for HSCR genes. This comprehensive profile of ENS gene expression refines our understanding of ENS development and serves as a resource for future developmental, biochemical, and human genetic studies.
Conflict of interest statement
Conflict of interest statement: No conflicts declared.
Figures
Similar articles
-
Correlation between multiple RET mutations and severity of Hirschsprung's disease.Pediatr Surg Int. 2013 Feb;29(2):157-63. doi: 10.1007/s00383-012-3196-1. Pediatr Surg Int. 2013. PMID: 23114404
-
Genetic variants in RET, ARHGEF3 and CTNNAL1, and relevant interaction networks, contribute to the risk of Hirschsprung disease.Aging (Albany NY). 2020 Mar 6;12(5):4379-4393. doi: 10.18632/aging.102891. Epub 2020 Mar 6. Aging (Albany NY). 2020. PMID: 32139661 Free PMC article.
-
A Novel Zebrafish ret Heterozygous Model of Hirschsprung Disease Identifies a Functional Role for mapk10 as a Modifier of Enteric Nervous System Phenotype Severity.PLoS Genet. 2016 Nov 30;12(11):e1006439. doi: 10.1371/journal.pgen.1006439. eCollection 2016 Nov. PLoS Genet. 2016. PMID: 27902697 Free PMC article.
-
Genetic model system studies of the development of the enteric nervous system, gut motility and Hirschsprung's disease.Neurogastroenterol Motil. 2009 Feb;21(2):113-27. doi: 10.1111/j.1365-2982.2008.01256.x. Neurogastroenterol Motil. 2009. PMID: 19215589 Free PMC article. Review.
-
Enteric nervous system development: migration, differentiation, and disease.Am J Physiol Gastrointest Liver Physiol. 2013 Jul 1;305(1):G1-24. doi: 10.1152/ajpgi.00452.2012. Epub 2013 May 2. Am J Physiol Gastrointest Liver Physiol. 2013. PMID: 23639815 Free PMC article. Review.
Cited by
-
Generation and characterization of Tmeff2 mutant mice.Biochem Biophys Res Commun. 2012 Aug 24;425(2):189-94. doi: 10.1016/j.bbrc.2012.07.064. Epub 2012 Jul 22. Biochem Biophys Res Commun. 2012. PMID: 22828515 Free PMC article.
-
Effect of colon transection on spontaneous and meal-induced high-amplitude--propagating contractions in children.J Pediatr Gastroenterol Nutr. 2015 Jan;60(1):60-4. doi: 10.1097/MPG.0000000000000565. J Pediatr Gastroenterol Nutr. 2015. PMID: 25221933 Free PMC article.
-
Neuron-Glia Interaction in the Developing and Adult Enteric Nervous System.Cells. 2020 Dec 31;10(1):47. doi: 10.3390/cells10010047. Cells. 2020. PMID: 33396231 Free PMC article. Review.
-
Synergistic effects of Ret coding and enhancer loss-of-function alleles cause progressive loss of inhibitory motor neurons in the enteric nervous system.bioRxiv [Preprint]. 2025 Jan 23:2025.01.23.634550. doi: 10.1101/2025.01.23.634550. bioRxiv. 2025. PMID: 39896597 Free PMC article. Preprint.
-
Mouse intestinal tuft cells express advillin but not villin.Sci Rep. 2020 Jun 1;10(1):8877. doi: 10.1038/s41598-020-65469-0. Sci Rep. 2020. PMID: 32483224 Free PMC article.
References
-
- Gershon M. D., Kirchgessner A. L., Wade P. R. Functional Anatomy of the Enteric Nervous System. New York: Raven; 1994.
-
- Burns A. J., Douarin N. M. Development (Cambridge, U.K.) 1998;125:4335–4347. - PubMed
-
- Anderson R. B., Stewart A. L., Young H. M. Cell Tissue Res. 2006;323:11–25. - PubMed
-
- Gershon M. D. Curr. Opin. Neurobiol. 1997;7:101–109. - PubMed
-
- Sang Q., Young H. M. Cell Tissue Res. 1996;284:39–53. - PubMed
Publication types
MeSH terms
Substances
Grants and funding
LinkOut - more resources
Full Text Sources
Other Literature Sources
Molecular Biology Databases
